SLOPE-INTERCEPT
POINT-SLOPE
SLOPES OF LINES
CONNECTIONS
Scatterplots and Lines of Fit
100
I am how Slope-Intercept form is written.
What is y=mx+b.
100
I am how Point-Slope form is written.
What is y-y=m(x-x)?
100
I am the formula used to find slope if I know two points.
What is m=(y-y)/(x-x)?
100
I am the equation for the line in Slope-Intercept form that has a slope of 6 and passes through the point (2,15).
What is y=6x+3?
100
This is the grade point average of a student who spends 6 hours a week on homework.
GPA is 2.0 (that means do more homework!)
200
I am the equation for a line in Slope-Intercept form that has a slope of 8 and a y-intercept of -7.
What is y=8x-7.
200
I am the equation in Point-Slope form for the line with a slope of -2 that goes through the point (5,9).
What is y-9=-2(x-5)?
200
I am the slope of the line that passes through the points (7,2) and (4,8).
What is -2?
200
I am the equation for the line in Slope-Intercept form that has a slope of -2 and passes through the point (-4,0).
What is y=-2x-8?
200
What kind of correlation is the graph representing?
What is "no correlation"?
300
I am the slope and y-intercept of the line y=-4x+84.
What is a slope of -4 and a y-intercept of 84?
300
I am the equation for the line in Point-Slope form that has a slope of 17 and passes through the point (-2,-4).
What is y+4=17(x+2)?
300
I am the slope of the line that passes through the points (-2,-4) and (-8,-1).
What is -1/2?
300
I am the equation for the line in Slope-Intercept form that passes through the points (8,2) and (12,10).
What is y=2x-14?
300
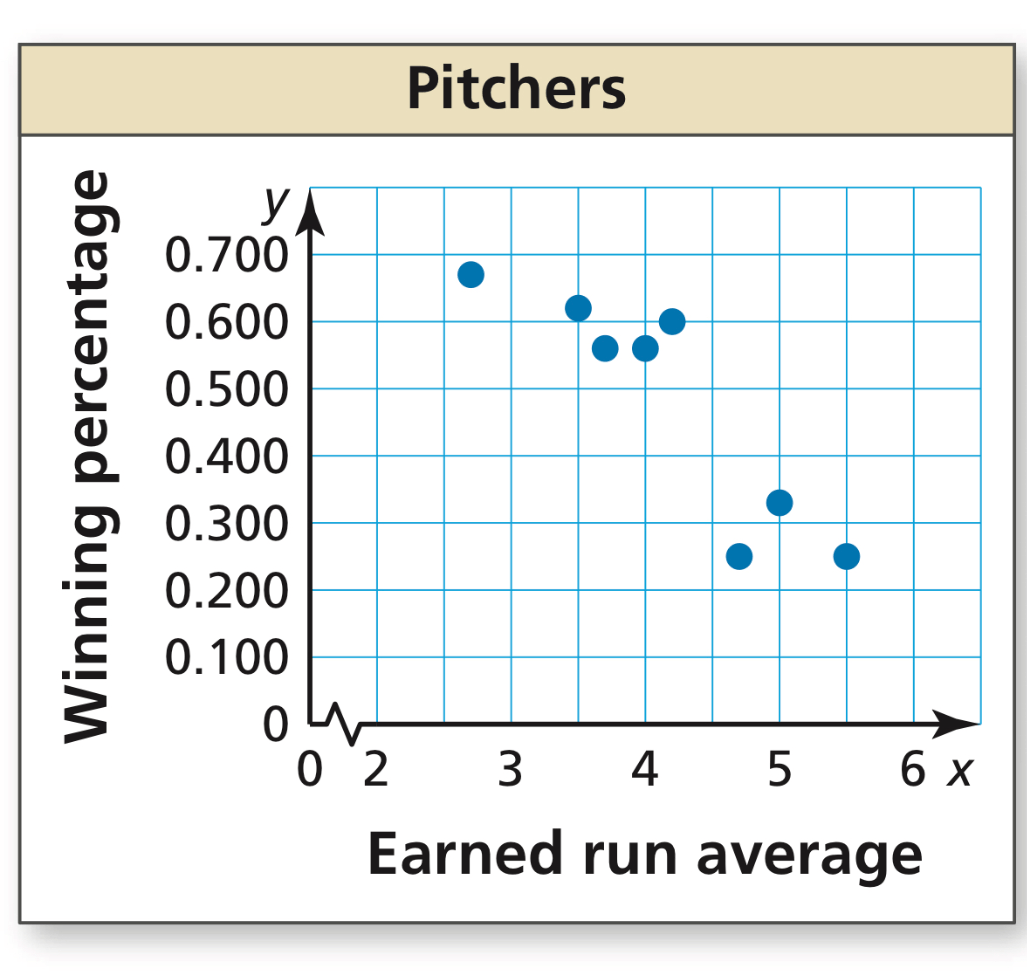 This scatter plot shows the earned run averages and the winning percentages of eight pitchers on a baseball team. This is what tends to happen to the winning percentage as the earned runs average increases?
What is DECREASES?
400
I am the equation for the line 6x+2y=10 in Slope-Intercept form.
What is y=-3x+5?
400
I am the equation for the line in Point-Slope form that passes through the points (7,2) and (11,9).
What is either y-2=7/4(x-7) or y-9=7/4(x-11)?
400
I am the slope of the line that passes through the points (1,0) and (0,8).
What is 8?
400
I am the equation for the line in Slope-Intercept form that passes through the points (9,1) and (12,-5).
What is y=-2x+19?
400
The table shows the mileages x (in thousands of miles) and the selling prices y (in thousands of dollars) of several used automobiles of the same year and model. Find an equation of the line of best fit and find the mileage of an automobile that costs $15.5 thousand dollars.
y=-0.2x+20 and 22,500 miles
500
I am the slope and y-intercept of the line x=10.
What is a slope that is undefined and there is no y-intercept.... (Since this is the equation of a vertical line).
500
I am the equation for the line in Point-Slope form that passes through the points (8,4) and (10,-5).
What is either y-4=-9/2(x-8) or y+5=-9/2(x-10)?
500
I am the slope of the line that passes through the points (4,2) and (4,24).
What is UNDEFINED?
500
I am the equation for the line in POINT-SLOPE form that has a slope of "j" and passes through the point (a,b).
What is y-b=j(x-a)?
500
The table shows the number of x teachers and the number of y students in each of several schools. Find an equation of the line of best fit, rounding to the nearest whole number.
y=21x+42