The value in a data set that occurs with the greatest frequency
What is the mode?
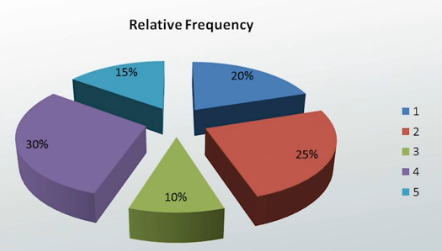
Frequency of the class divided by the number of entries
What is relative frequency?
What is the mean of the following data set: 1, 3, 4, 5, 2
What is 3?
Refers to computer output of data to a user, and assimilation of information from such outputs
What are data displays?
The branch of mathematics concerning the numerical descriptions of how likely an event is to occur.
What is probability?
Another name for the second quartile
 This is used to graphically show percent frequency
What is a pie chart?
All excel functions must begin with what
What is an equal sign?
The three data points used to make the box in a box and whisker plot
What is Q1, median, and Q3
 This probability is calculated by listing all of the possible outcomes of the activity and recording the actual occurrences, such as tossing a coin or rolling a dice.
Classical Probability?
 A graphical display of data through quartiles
What is a box plot?
Summing the relative frequencies should sum to this number
What is 1?
____ is the mode of this dot plot
What is 1?
What is a bar graph
The probability of an event that is obtained with the additional information that some other event has already occurred.
What is conditional probability?
A collection of values that is finite or countable
What are discrete random variables?
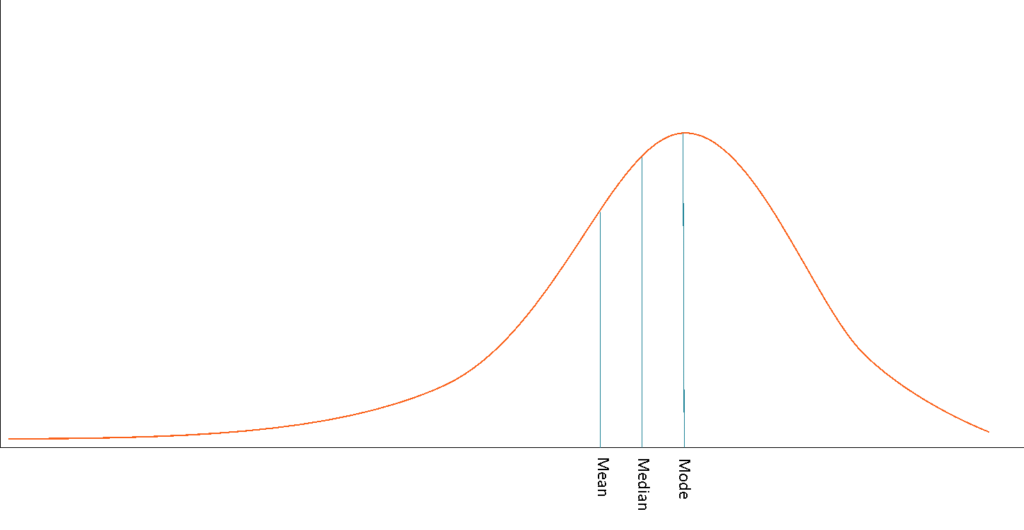
 If there is a higher frequency for higher values, the data has this skewness
What is left skewness?
Define the term median
What is the middle value in a data set?
 The stem in the stem-and-leaf plot represents this value
What is the tens place value
These are the three major typer of probability
What is Theoretical, Experimental, and Axiomatic Probability?
This weighted average summarizes the variability in the values of a random variable
What is the Variance?
The sum of all frequencies is referred to as this
What is the absolute frequency?
What is the data value is below the mean?
 A bar graph that shows the frequency of data within equal intervals
What is a histogram?
This Theorem describes the probability of an event, based on the prior knowledge of conditions that might be related to the event.
What is Bayes Theorem?
