Parts of an Experiment
Scientific Investigation
General Relationships
Types of Data
Anything Goes
100
This is the variable intentionally changed by the investigator.
What is the independent variable?
100
This is the group that receives the treatment.

What is the experimental group?
100
This is the name of the relationship when both variables increase at the same time.

What is a direct relationship?
100
This type of data is collected by using the five senses?
What are OBSERVATIONS?
100
This is the general relationship for the following results.
Amount of Exercise (min): 10, 20, 30, 45, 60
Calories Burned (kcal): 20, 40, 60, 90, 120
What is DIRECT?
200
This is the variable we measure in an experiment.

What is the dependent variable?
200
This is the group that does NOT receive the treatment.

What is the control group?
200
This is the name of the relationship when one variable increases while the other variable decreases.
What is an inverse/indirect relationship?
200
This is used to organize data collected in an experiment.
What are DATA TABLES AND GRAPHS?
200
These are two lab safety procedures students should always follow.
What is: (many possibilities...)
- Wear goggles
- Follow directions
- Wear gloves
- No horseplay
- No eating
- Do not drink chemicals
etc...
300
We need this variable to keep the experiment fair. It is kept the same so the experimenter knows what is causing the DV to change.
What is a constant (control variable)?
300
This is the format used to write a hypothesis.
What is: If... then... because...?
300
This is the relationship between variables where one variable changes but the other variable stays the same.
What is a constant relationship?
300
The following are results from my experiment: 12ft, 14ft, 17ft, and 3ft.
This represents the type of data that uses numbers and measurements.
What is QUANTITATIVE DATA?
300
This is the volume of liquid in the graduated cylinder.
<blockquote class="imgur-embed-pub" lang="en" data-id="a/1MHumUP"><a href="//imgur.com/a/1MHumUP"></a></blockquote><script async src="//s.imgur.com/min/embed.js" charset="utf-8"></script>
What is 20 ml?
400
We need this group in an experiment to compare results. Since this group does not receive the treatment, is shows us the "normal" or "expected" results and whether or not the "treatment" works.
What is the control group?
400
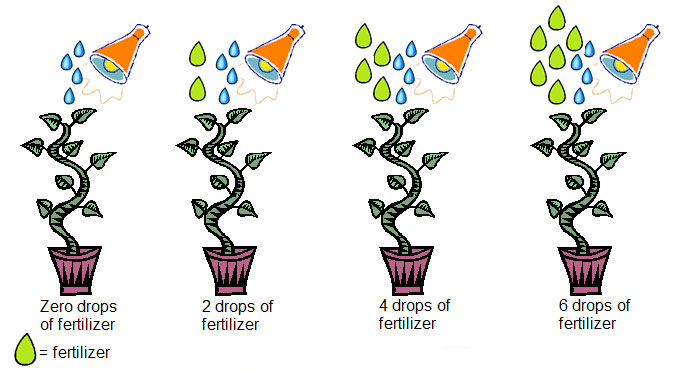
This is a possible hypothesis using the correct format for the given variables:
IV: Types of Fertilizer (A,B,C)
DV: Plant Growth
What is:
Many answers
Example: IF we use fertilizer A/B/C, THEN plants will grow faster/slower BECAUSE...
400
This is an example of a direct relationship in the real world.
What is...
Many possibilities — more sugar causes more cavities, more sunlight causes more plant growth, etc.
Ex: As the amount of food you eat increases, the amount you weigh also increases.
400
Data Collected from experiment: Blue truck, Green Truck, Yellow Truck, Black Truck, Red truck
This type of data uses words.
What is QUALITATIVE DATA?
400
Based on this data table's pattern, this is the number of Bacteria B predicted at 6 hours.
<img src="https://i.imgur.com/PJC8Fw8.png">
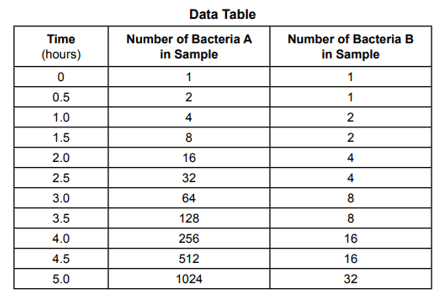
What is 64?
500
This is a possible hypothesis for the following experiment.
You want to see how the different types of IG posts affect the number of likes you receive.
IV: Types of IG posts (selfie, video, OOTD)
DV: # of likes
What is...
If ________ Then ______ Because....?
Ex: If I post a selfie then I will receive more likes because I am beautiful and people enjoy seeing my face.
500
Chelsea and Gregory conduct an experiment where Chelsea watches Stranger Things on Netflix for 1 hour, while Gregory watches the same show on Netflix for 2 hours. They both watch in the evening on a Tuesday using their smart TVs. After watching, they measure their level of happiness on a scale from 1 to 10.
These are the IV, DV, and CV (constants) in this experiment.
What is:
IV: Hours of Netflix Watched
DV: Level of Happiness on a scale of 1-10
CV: They watch the same show, on a smart TV, on the same day, using the same scale etc...
500
This is an example of a constant relationship in the real world.
What is:
Many possibilities — for instance, as you drink more water, there is no effect on the amount of rain that falls from the sky
500
After I make an observation, I can do this to try to explain what I saw.
What is INFER?
500
A student placed three identical plant seedlings in three identical containers and gave each seedling a different amount of water each day. The student measured the height of each seedling ever day for four days.
These are the IV, DV, and CVs.
What is:
IV: Amount of Water Given?
DV: Height of Seedling?
CV: Type of seedling, soil, containers etc...?