Probability
Sampling and Data
Plots
Measures of Center/Variation
Potpourri
100
A class consists of 13 women and 49 men.
a) If a student is randomly selected, what is the probability that the student is a woman?
b) If two different students are chosen, what is the probability that they are both men?
c) If 3 students are chosen, find the probability that at least one of them is a woman.
a) 0.2097
b) 0.6219
c) 0.5129
100
Determine whether the given value is a parameter or a statistic:
a) A sample of 120 employees of a company is selected and the average age is found to be 37 years.
b)After inspecting all of 55000 kg of meat stored at the Wurst Sausage Company, it was found that 45000 kg of the meat was spoiled.
a) Statistic
b) Parameter
100
List the original data from the stem-and-leaf plot.
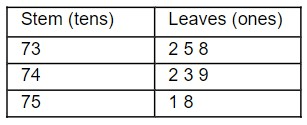
732, 735, 738, 742, 743, 749, 751, 758
100
The distances traveled (in miles) to 7 different swim meets are:
12, 18, 31, 46, 69, 71, 85
a) Find the median distance traveled.
b) Find the mean distance traveled.
c) Find the standard deviation
d) Find the mode.
e) Find the midrange
f) Find the variance.
a) 46 miles
b) 47.4 miles
c) 28.4 miles
d) none
e) 48.5 miles
f) 804.3
100
You have to wait 90 minutes in the emergency room of a hospital before you can see a doctor. You learn that your wait time was in the 82nd percentile of all wait times. Explain what this means, and whether you think it is good or bad.
82% of the people in the emergency room had shorter waiting times than you did. This is not a good thing for you.
200
An archer hits the center of the target (the bullseye) 70 percent of the time. However, she is a streak shooter, and if she hits the center on one shot, her probability of hitting it on the shot immediately following is 0.85. Written in probability notation:
P(A) = P(B) = P(hitting the center on one shot) = 0.70
P(B|A) = P(hitting the center on a second shot, given that she hit it on the first) = 0.85
a) Calculate the probability that she will hit the center of the target on two consecutive shots.
b) Are P(A) and P(B) independent in this example?
a) 0.595
b) No
200
Identify the description as an observational study or an experiment?
a) A quality control specialist compares the output from a machine with a new lubricant to the output of machines with the old lubricant.
b) A stock analyst selects a stock from a group of twenty for investment by choosing the stock with the greatest earning per share reported for the last
quarter.
a) Experiment
b) Observational Study
200
Make a histogram for the frequency table below.

200
The value, in thousands of dollars, for houses on a block, are: 450; 470; 475; 510; 535; 125.
a) Calculate the mean for this data.
b) Calculate the median for this data.
c) Which do you think better reflects the average value of the homes on this block?
a) $427,500
b) $472,500
c) The median, because the mean is distorted by the low value of one house.
200
Suppose that you are buying a house. You and your realtor have determined that the most expensive house you can afford is the 34th percentile. The 34th percentile of housing prices is $240,000 in the town you want to move to. In this town, can you afford 34% of the houses or 66% of the houses?
You can afford 34% of houses. 66% of the houses are too expensive for your budget. INTERPRETATION: 34% of houses cost $240,000 or less. 66% of houses cost $240,000 or more.
300
The table below describes the smoking habits of a group of asthma sufferers.
a) If one of the 930 subjects is randomly selected, find the probability that the person chosen is nonsmoker given that it is a woman.
b) What is the probability of choosing one subject who smokes?
c) If a subject is a smoker, what is the probability that it is a man who is a heavy smoker?
d) If three subjects are selected, what is the probability that all three are nonsmoking men?
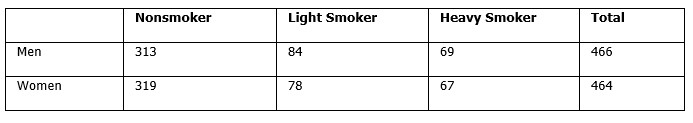
a) 319/464 = 0.688
b) 298/930 = 0.320
c) 69/298 = 0.232
d) 313/930 x 312/929 x 311/928 = 0.038
300
Identify the sample and the population. Is the sample a good sample? Why or
why not?
a) An employee at the local ice cream parlor asks three customers if they likechocolate ice cream.
b) In a poll of 5000 college students who responded to a survey on Facebook, 74% answered "yes" when asked "Do you have a television in your dorm room?"
a) Sample: 3 customers
Population: All potential customers
Not a good sample, to small and not random.
b) Sample: 500 randomly selected college students
Population: All college students
Not a good sample, voluntary response
300
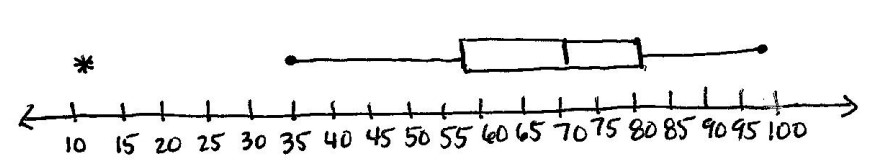
Find the five-number summary and check for outliers, then make a box plot.
The test scores of 40 students are listed below.
12 35 43 44 47 48 54 55 56 57
59 62 63 65 66 68 69 69 71 72
72 73 74 76 77 77 78 79 80 81
81 82 83 85 89 92 93 94 97 98
5 number summary: 12, 58, 72, 81, 98
IQR: 23 Fences: 115.5 & 23.5
Outlier: 12
300
Use the following data: 10; 11; 15; 15; 17; 22
a) Compute the mean and standard deviation for this data.
b) What number is two standard deviations above the mean of this data?
a)
mu=15
s = 4.3
b) 23.6
300
Jesse was ranked 37th in his graduating class of 180 students. At what percentile is Jesse’s ranking?
80th percentile
400
About 35% of the population has blue eyes.
a) If someone is randomly selected, what is the probability that he or she does not have blue eyes.
b) If four different people are randomly selected, what is the probability that they all have blue eyes?
c) If four different people are randomly selected, what is the probability that at least one has blue eyes?
a) 0.65
b) 0.015
c) 0.8215
400
A health club is interested in knowing how many times a typical member uses the club in a week. They decide to ask every tenth customer on a specified day to complete a short survey including information about how many times they have visited the club in the past week.
a) What kind of a sampling design is this?
cluster, stratified, simple random, or systematic
b) “Number of visits per week” is what kind of data?
qualitative, quantitative-continuous, or quantitative-discrete
a) systematic
b) quantitative-discrete
400
A survey was conducted of 130 purchasers of new BMW 3 series cars, 130 purchasers of new BMW 5 series cars, and 130 purchasers of new BMW 7 series cars. In it, people were asked the age they were when they purchased their car. The following box plots display the results.
- What percentage of BMW 5 series purchasers where older than 75% of BMW 3 series purchasers?
- What percentage of BMW 7 series purchasers were younger than 50% of BMW 5 series purchasers?
- What is the approximate median age of BMW series 7 purchasers?
- Compare the three box plots. What do they imply about the age of purchasing a BMW from the series when compared to each other.
a) 50%
b) 25%
c) 46
d) Comparing the median ages, younger people tend to buy the BMW 3 series, while older people tend to buy the BMW 7 series.
400
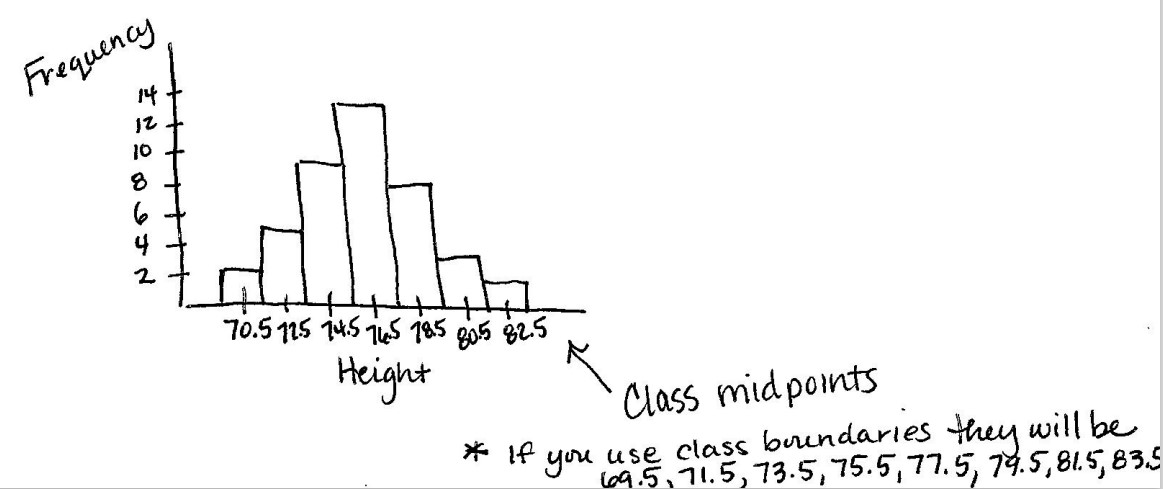
Find the mean height of the players using the frequency table below:
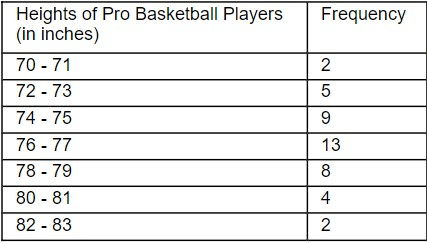
The mean height is 76.36 inches.
400
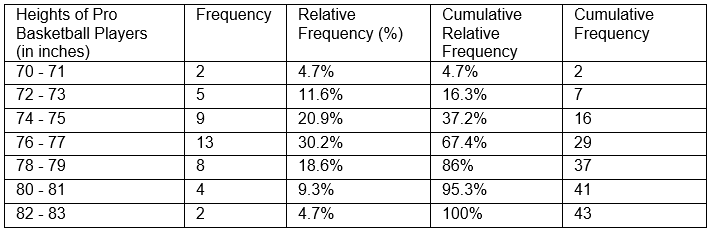
Using the frequency table below, find the:
a) Relative Frequencies (Round to 1 decimal place)
b) Cumulative Relative Frequencies
c) Cumulative Frequencies

500
Of the 57 people who answered “yes” to a question, 8 were male. Of the 61 people that answered “no” to the question, 5 were male. (Hint: Make a contingency table to organize information)
a) If one person is selected at random from the group, what is the probability that the person answered “yes” or was male?
b) If a person answered “no” to the question, what is the probability that the person is female?
c) What is the probability of selecting two different people who both are male and answered “yes”?
a) 0.525
b) 0.918
c) 0.004
500
A grocery store is interested in how much money, on average, their customers spend each visit in the produce department. Using their store records, they draw a sample of 1,000 visits and calculate each customer’s average spending on produce.
a) What kind of data is "amount of money spent on produce per visit?"
qualitative, quantitative-continuous, or quantitative-discrete
b) The study finds that the mean amount spent on produce per visit by the customers in the sample is $12.84. This is an example of a:
population, sample, parameter, statistic, or variable
a) quantitative-continuous
b) statistic
500
Given the following table, find:

a) The percentage of professional basketball players that are 79 inches tall or shorter.
b) The number of professional basketball players that 73 inches tall or shorter.
c) The percentage of professional basketball players that are at least 82 inches tall.
a) 86%
b) 7
c) 4.7%