Extras
Terms
Graphs
Frequency
Calculations
100
What is the mode of the following data set?
0, 1, 2, 4, 2, 5, 3, 5, 2, 3, 4, 1, 0, 5, 7, 2
2
100
What does σ represent?
The population standard deviation
100
Skewed left, right, or neither?
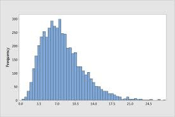
Right
100
What is the class width?
Min = 5
Max = 38
N = 11
4
100
Calculate Q1 for the following data set:
2.5, 5, 7.5, 10, 12.5, 15, 17.5
5
200
What is the median?
1, 1.5, 2, 2.5, 3, 3.5, 4, 4.5, 5
3
200
Determine the sampling method: a researcher selects every 5th person in a line to participate in a study.
Systematic
200
Would you use the Empirical Rule, Chebyshev's Inequality, or neither on the following graph?

Chebyshev's Inequality
200
What are the midpoints and how did you find them?
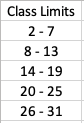 |
5, 11, 17, 23, 29
(Lower class 1 + Lower class 2) / 2
200
Calculate the mean of the grouped data set:
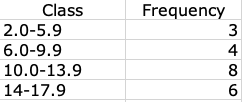
11.238
300
Determine the sampling method:
A study was conducted on children at a local elementary school. The students were separated into 15 classrooms and all of the students from 3 classrooms were selected.
Cluster
300
What does IQR stand for? What is the equation for it?
Interquartile Range, Q3-Q1
300
If I have a graph that is skewed to the left, is the mean or the median larger?
Median
300
What are the cumulative frequencies?
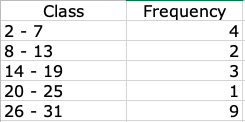 | |
4
6
9
10
19
300
Calculate the z-score for a value of 22.1 if you found that the standard deviation = 2.5 and the mean = 27.3. Is this usual or unusual?
-2.08, unusual
400
What is the mean of the data set?
2, 2, 7, 8, 10, 11, 14
7.714
400
Is temperature a nominal, ordinal, discrete, or continuous variable?
Continuous
400
What is an ogive? Either explain or draw an example.
Used on a cumulative frequency histogram, put dots on the furthest right point on each bar and connect the dots with straight lines.
400
What are the relative frequencies?
0.211
0.105
0.158
0.053
0.474
400
Calculate the variance:
96.13
500
What goes into a 5 number summary?
Min, Q1, Median, Q3, Max
500
What type of observational study (cross sectional, prospective, retrospective) is this:
A test is collected from the MVA over the last 4 months to determine the proportion of women compared to men that passed their driver's test.
Retrospective
500
What percentage of the data is below 21.8?
Normal (symmetric) Curve
Mean = 25
Standard deviation = 3.2
16%
500
Draw the relative and cumulative frequency histograms for the following data:
*SI will check
500
Calculate the sample standard deviation of the grouped data set:
| |
4.122