Charts
5 Number Summary
Z-scores
Correlation + Regression
Conceptual
100
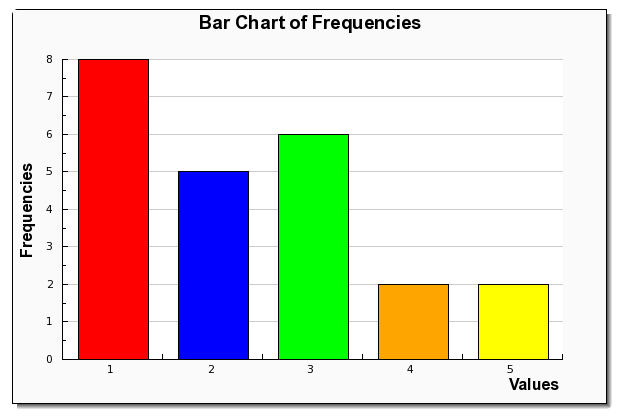
What is the frequency of 4 and 2?
7
100
Given the following data set: 12, 15, 18, 21, 23, 25, 27, 30, 32, 35
Find the five-number summary.
Minimum: 12
Maximum: 35
Median (Q2): 24
Q1: 18
Q3: 30
100
z* such that P{ -z* < Z < z* } = .81
OTHER WORDS: z scores for the middle 81%
-1.31, 1.31
100
If you have an r-value of -0.79, what can you conclude about the relationship of the two variables?
That there is a strong, negative relationship
100
If you have a z-score of 1.98, can you safely assume that at least 5% of the data lies above that point.
False, 1.98=0.9761, so only 2.39% of the data lies above it
200
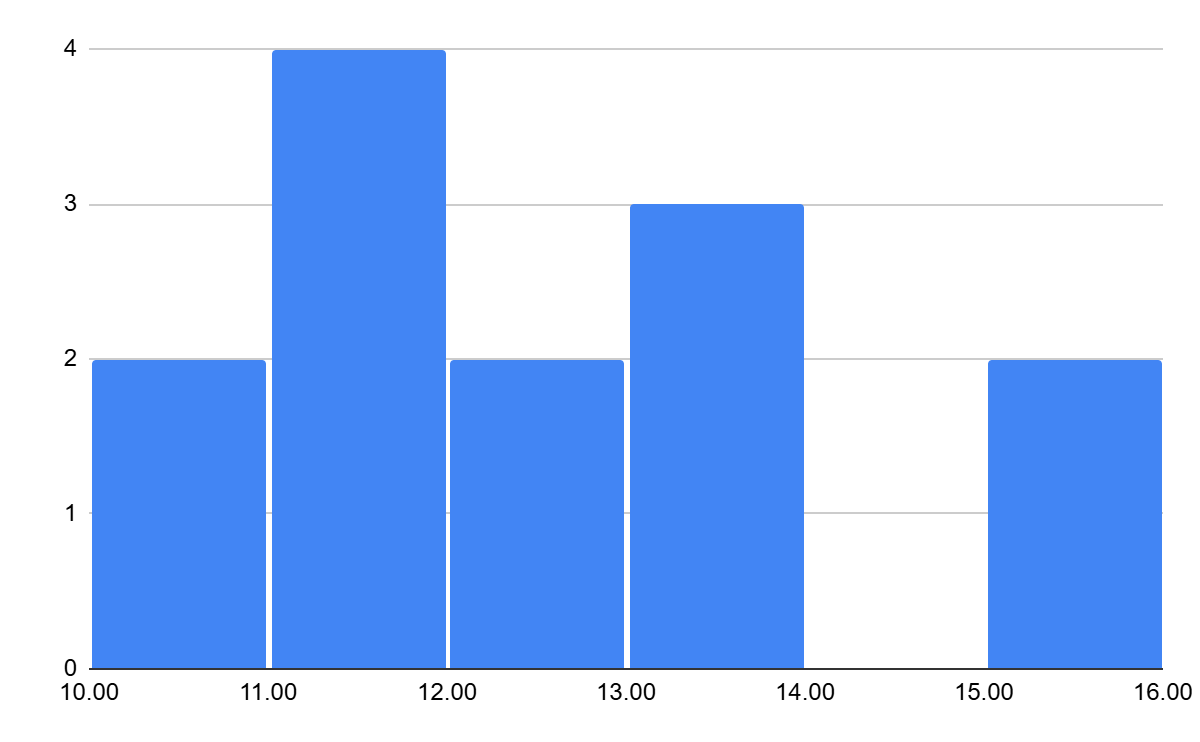
Create a histogram for the following data:
10.2, 11.5, 15.3, 13.2, 10.9, 11.7, 12.3, 12.1, 15.6, 13.8, 13.5, 11.4, 11.2
200
Given the following data set: 5, 8, 10, 12, 14, 15, 18, 20, 22
Find the IQR
19-9=10
200
x* such that P{ X > x* } = .4 if the mean is 17 and the standard deviation is 2.1
OTHER WORDS: What would the x value be if 40% of the data lies above it when the mean is 17 and the standard deviation is 2.1
17.53
200
WHAT'S WRONG WITH THIS?
You are running a correlation and find that r= 1.2, you conclude that there is a STRONG POSITIVE correlation, but cannot conclude that one causes the other.
R should be between -1 and 1
200
What is the difference between the 68-95-99.7 and a z-score
One is an estimate and the other is exact
300
If data is normally distributed and you have a z-score of -1.2. Draw an approximate distribution of where that point lands
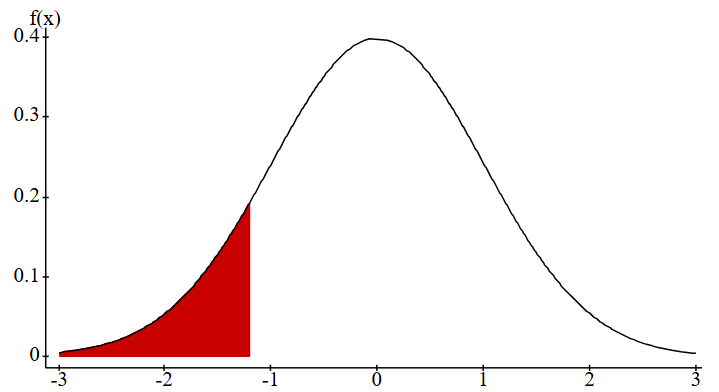
300
Given the following data set: 40, 45, 50, 55, 60, 65, 70, 75, 120
Find the five-number summary and identify any outliers.
Minimum: 40
Maximum: 120
Median (Q2): 60
Q1: 47.5
Q3: 72.5
IQR (Interquartile Range): Q3 - Q1 = 72.5 - 47.5 = 25
Lower Bound: Q1 - 1.5 * IQR = 47.5 - 1.5 * 25 = 10
Upper Bound: Q3 + 1.5 * IQR = 72.5 + 1.5 * 25 = 110
120 is an outlier
300
Scores on a standardized test are normally distributed with a mean of 500 and a standard deviation of 100.
What is the z-score for a score of 450?
What is the z-score for a score of 600?
What proportion of test-takers scored between 450 and 600?
z= -0.5, 1.0
53.28% in between
300
What is special about residuals for least-squares regression?
Residuals for least-square regression have a special property: they sum to 0. This means that some will be positive and some will be negative
300
If you add all the proportions of a proportion table, it should equal ____
1 or 100%
400
create a box and whisker plot for this data:
1, 3, 5, 6, 7, 9, 10, 13, 14, 15, 15
end at 1, start of box at 5, line in box at 9, end of box at 14, and end of plot at 15
400
calculate the mean and standard deviation of this dataset:
2, 5, 3, 8, 10, 28, 14, 6, 7, 11, 20, 17
mean: 10.92
standard deviation: 7.67
400
The average score on a biology exam is 75. A student scored 85 on the exam, and their z-score was 2.0. What is the standard deviation of the exam scores?
5
400
A student collects data on the number of hours studied and exam scores for a class of 25 students. They perform a linear regression analysis and obtain the following equation for the line of best fit:
Predicted Exam Score = 65 + 7 * (Hours Studied)
For a particular student who studied 8 hours, their actual exam score was 89.
What is the predicted exam score for this student, based on the regression line?
What is the residual for this student?
Explain what the residual means in the context of this problem.
Predicted: 121
Residual: -32
In the context of this problem, the residual of -32 means that the student's actual exam score (89) was 32 points lower than the score predicted by the regression line (121). The regression line overestimated this student's performance.
400
Explain regression outputs
they are an ESTIMATE based on data, but are subject to being inaccurate due to extreme scores