Equations
Inequalities
Scatter Plots
Domain and Range
Random!!
100
Solve the equation
5(7x+2)=45
x=1
100
Solve the inequality
x/5-6<1
x<35
100
Correctly identify each of the 3 correlations (trends) according to the scatter plots
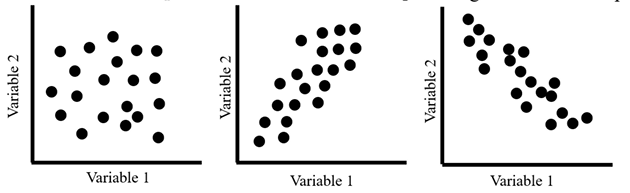
no correlation, positive, negative
100
Domain represents the ____-values of a relation. Range represents the ____-values of a relation.
Domain is the x-values and range is the y-values.
100
What operation do you use when finding the area of a composite shape with a shaded region?
Subtraction
200
Solve the equation
7+6x-11-8x=16
x=-10
200
Solve the inequality
2(3x+4)>=44
x>=6
200
Cameron drove his car on a road trip. The scatter plot shows the relationship between the distance traveled and gas used during Cameron's road trip.
Look at the graph and describe the relationship between distance traveled and gas used.
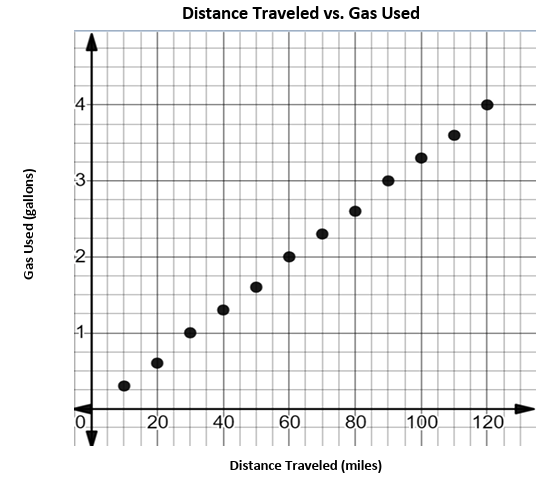
As the distance traveled increases, the amount of gas used increases. This is a positive correlation.
200
Sabrina's teacher asked her to list the range for the function represented in the table below.
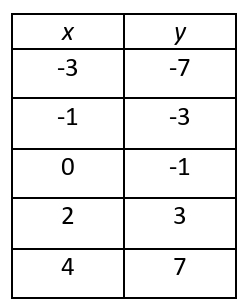
What should Sabrina write as the range of this function?
(-7, -3, -1, 3, 7)
200
One of the coldest recorded temperatures in Florida was -3 degrees Fahrenheit. Fahrenheit (F) and Celsius (C) temperatures are related by the formula given below. What is the Celsius temperature rounded to the nearest tenth?
F=9/5C+32
-19.4 degrees Celsius
300
Solve the equation
(5x-3)/-6=3
x=-3
300
DOUBLE POINTS!!!
Solve the inequality
-2x+2-3<9
x> -5
300
DOUBLE POINTS!!!
The scatterplot shows the number of hours that students spent studying and the final grade on their test. The data is displayed in the scatterplot below.
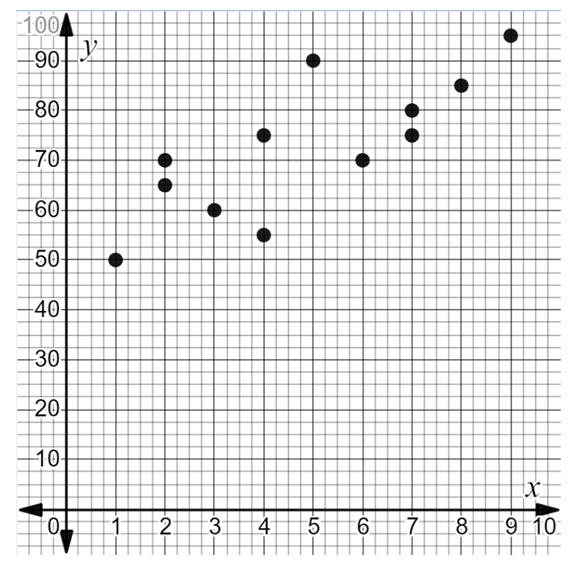
What would be an appropriate title for this scatterplot? What would you label the x-axis and y-axis?
Title: Hours Spent Studying vs. Final Grade
x-axis: number of hours spent studying
y-axis: final grade
300
DOUBLE POINTS!!!
What is the domain of the relation below? Is the relation a function?
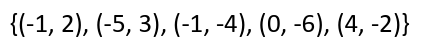
(-5, -1, 0, 4)
No, it is not a function, -1 is a repeated x-value.
300
Does the relation presented in the table below represent a function? Why or why not?
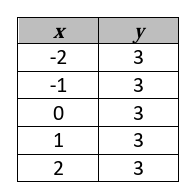
Yes, no repeating x-values.
400
DOUBLE POINTS!!!!
Solve the equation
-4x+7=-7x-20
x=-9
400
Solve the inequality
3(2-x)<=12-4x
x<=6
400
Jacob collected data on the age versus value of a car. These data are displayed in the table below. He also created a scatter plot to represent the data, but he made a mistake. Describe the mistake Jacob made.
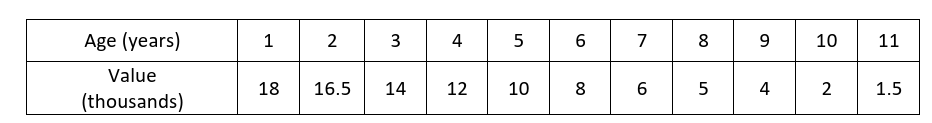
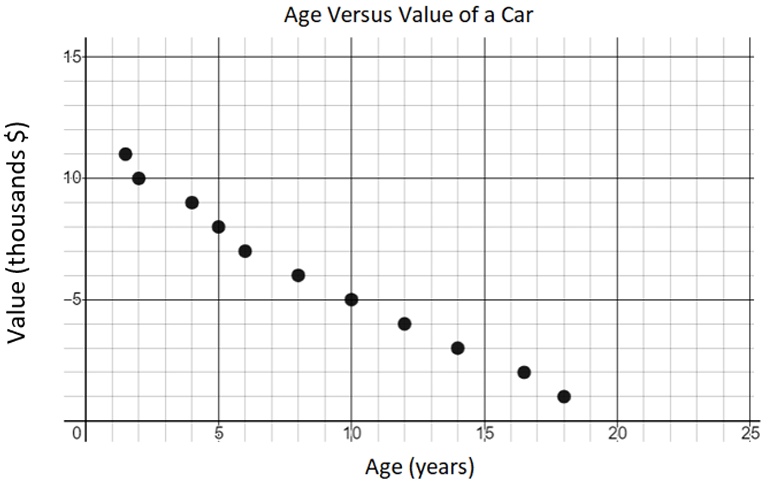
The points are plotted incorrectly.
400
The following graph shows a relation. What is the range of the relation?
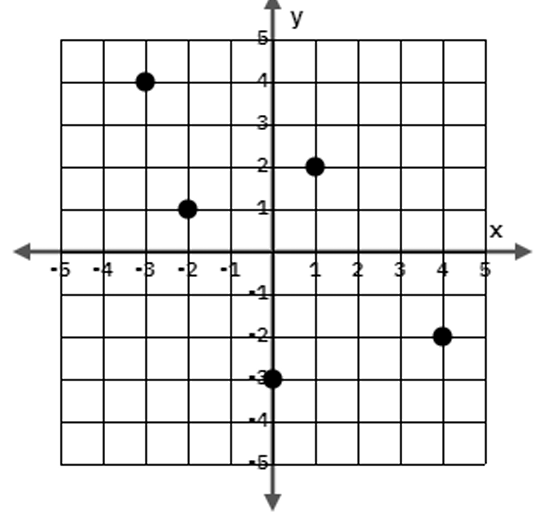
(-3, -2, 1, 2, 4)
400
DOUBLE POINTS!!!!
Look at the relation pictured on the coordinate plane. Is the relation a function? If not, identify one coordinate point that could be moved to make the relation a function.
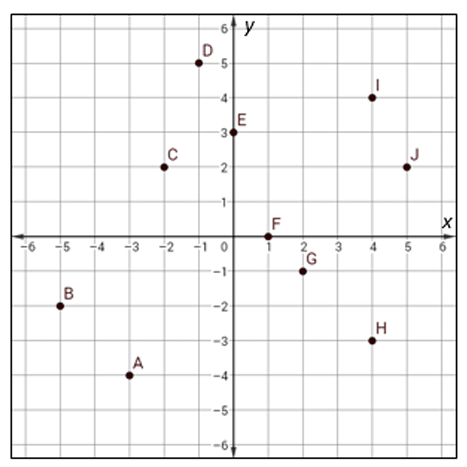
It is not a function. We can move either point I or point H because they share an x-value.
500
Solve the equation
3+2(8-x)=3x-1
x=4
500
Solve the inequality
4(x+2)+2x>=2x-8
x>=-4
500
Students from an 8th grade math class were asked to draw a line of best fit for the same scatterplot. Three students' work is displayed below. Which student drew the most accurate line of best fit? Explain why.
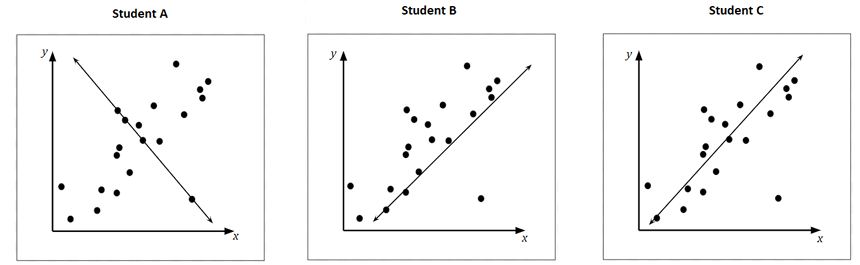
Student C because their line of best fit follows the trend of the data most accurately and there are about the same number of data points above and below the line of best fit.
500
Which relation has a domain of (-3, 1, 4, 5)?
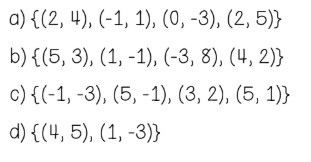
B
500
The total cost of plumbing services from a company includes a flat fee of $350 in addition to a rate of $18 per hour of work. If a builder hires the plumbing company to complete x hours of work, and the builder's total cost for plumbing services from the companies is no less than $625, which inequality could be used to determine the number of hours for which the company is hired?
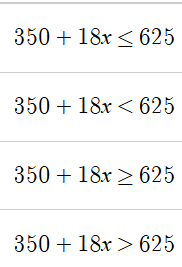
C, 350+18x>=625