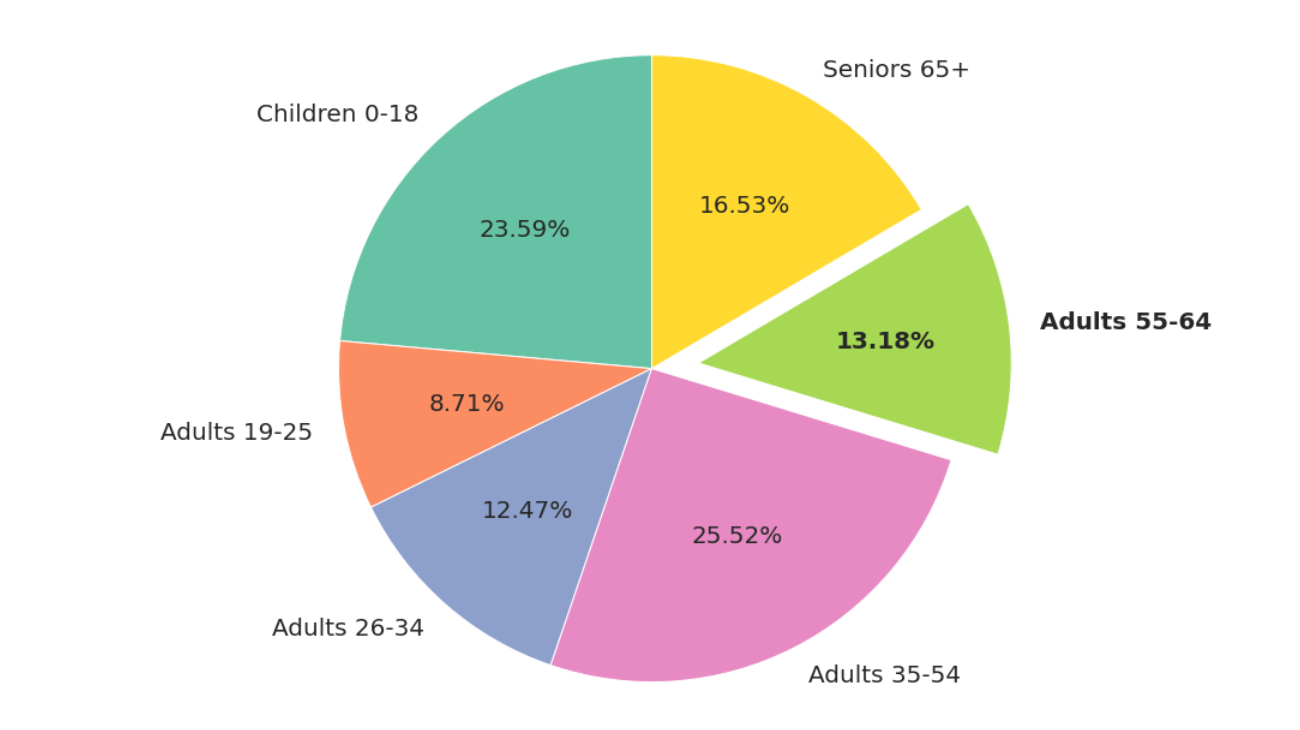
What is a good graph for categorical data?
Pie graph, bar graph or frequency table
Squares only have 4 sides, true or false.
true
10+10=
20
how many cents in a dollar?
100
jenny has a bag of 3 marbles, 2 of them are blue and 1 of them is red. What colour marble is the most likely to pick?
blue
what are the 2 types of data?
numerical and catigorical
an octagon has how many sides?
8
28x4=
112
sally makes $8 a week. how much money does she earn in 2 weeks?
16
 order the colours from most likely to least likely.
pink, aqua, yellow, green, blue, orange
what is an example of a discrete number?
what is a parallel line?
two lines and move in the same direction and do not meet.
98/3= (98 divded by 3)
32.6
Sally makes $9.70 a week. how much money does she earn in 5 weeks?
48.5
is it possible to go lower then this 0.0001%
yes
what is an example of a categorical nominal data question?
name, hair colour, gender etc
what is the name of a shape with 10 sides?
A decagon
(13503+3579) - 753=
16329
$40.87 x $72=
$2942.64
Write the sample space for rolling 1 die
why can't you put categorical data in a stem and leaf plot?
(teacher will decide if answers are valid)
how many shapes exist?
∞ infinite
1823x289 (313-22) 2931÷212=
2119617311.73
$123814872.89 x $1234=
152787552048
Whats the probability of Liam Cullen winning a Fortnite match in ranked?
Extremely Likely