One
Dos
Trois
Vier
100
Rewrite the expression below using exponents.
11*11*11*11
114
100
Evaluate the expression below.
43
64
100
A hockey team is nominating MVPs and will nominate player with more than 3 assists. Who will be nominated? (2)
Jamie, Janis, Manny, Joseph, and Allan
100
What was the greatest amount of time spent on a single app? (1)
11
200
On a typical summer day, the owners of a local lemonade stand recorded the times that they sold lemonades between 11 am and 7 pm. The results are displayed in the histogram below.
They decide to hire one extra worker to help when sales are the highest. Would it be more beneficial to hire an extra worker for before or after 3 pm? (4)
Before
200
Evaluate the expression below.
(-5)3
-125
200
Is the following equation true or false?
6^5=6+6+6+6+6
False
200
The salaries of the employees in a company were plotted in a histogram. Based on the histogram, how many employees earn between $60,000 and $90,000 per year? (3)
188
300
Raphael is a teacher at the local school. Every week he gives his students a 20 question quiz about what they learned throughout the week.
To analyze the students' knowledge on what they learned this week, he made a histogram and a dot plot with the students' scores on the quiz.
Let's say Raphael wants to know how many students got just one question wrong. Which graph is better for answering this question? (9)
Dot Plot
300
The table below shows a fast food restaurant's sales from yesterday. How many total hamburgers were sold? (5)
100
300
A number of random students in a school was asked if they had smartphones. Based on the data on the histogram below, how many students 15 years or older have a smartphone of their own? (6)
83
300
Below is the weekly sales data from a store, presented as a histogram and a line graph.
The store has a goal of $6,000 per week.
Let's say you want to know if sales been increasing or decreasing over the past year.
Which chart is better for answering this question? (10)
Line Graph
400
Complete the following equations. Enter your answer as a decimal if necessary.
77.66*10^3
77.66/10^3
77660
0.07766
400
Write the following number in scientific notation. Do not round.
26820
2.682 x 10⁴
400
Write the following number in standard form. Do not round.
9 x 10⁻²
0.09
400
Which city has the largest population? (19)
City A
500
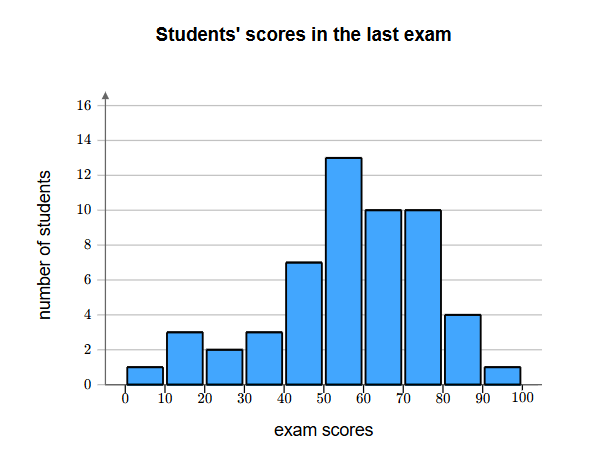
A teacher wants to visualize the performance of students on a recent exam. The scores ranging from 0 to 100 were recorded in a frequency table. Use the table's data to create a histogram representing the distribution of scores. (7)
500
Meteorologist Marie is studying temperature variations from the average in a month. She recorded the maximum temperature of the day in degrees Celsius for 31 days. Then, Marie subtracted the average temperature from each day's maximum temperature to find the difference and represented the data in a histogram. Choose the width of the histogram bins to best represent the data. (8)
Bin Width: 3 or 4
500
Simplify. Write your answer in scientific notation. Do not round.
(3.8*10^2)+(1.5*10^2)
5.3*10^2
500
Order the numbers from least to greatest.
A) 6.8*10
B) 4.1*10^6
C) 5.9*10^-7
D)3.7*10^5
C
A
D
B