Bar Graphs
Line Graphs
Random!
100
True or false: Bar graphs can be vertical and horizontal.
What is: True
100
These graphs use what to show data?
What is: Lines
100
How many classrooms have exactly 31 students?
What is: 1
200

What month did it rain the most?
What is: May
200
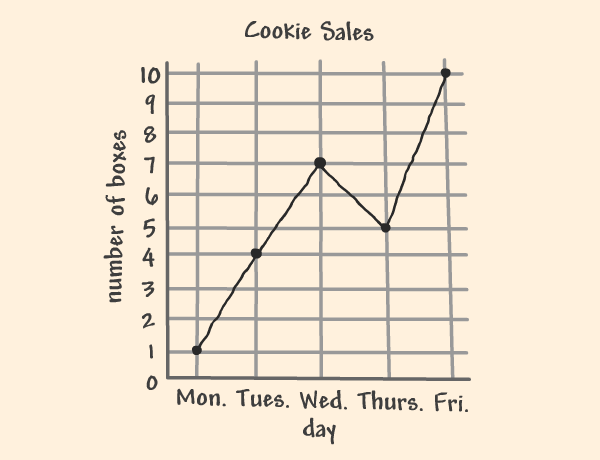 How many cookies were sold on Wednesday?
What is: 7
200
 What data is being collected here?
What is: Number of School Supplies
300

What months have the same amount of students?
What is: November and February
300
 What day were the fewest amount of push-ups done?
What is: Friday
300
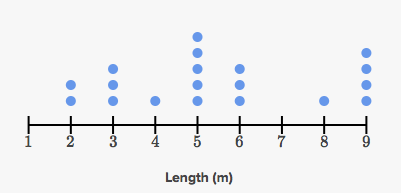
How many trees were at least 6 metres tall?
What is: 8
400
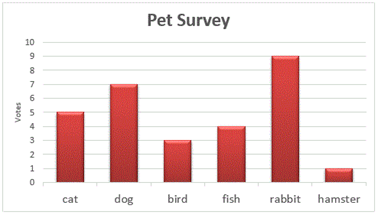 How many votes were included in this data?
What is: 29
400

What is the temperature difference from 8:00 AM-11:00 AM?
What is: 10 degrees
400
23 x 6
What is: 138
500
 What day of sale was most successful?
What is: Day 3
500
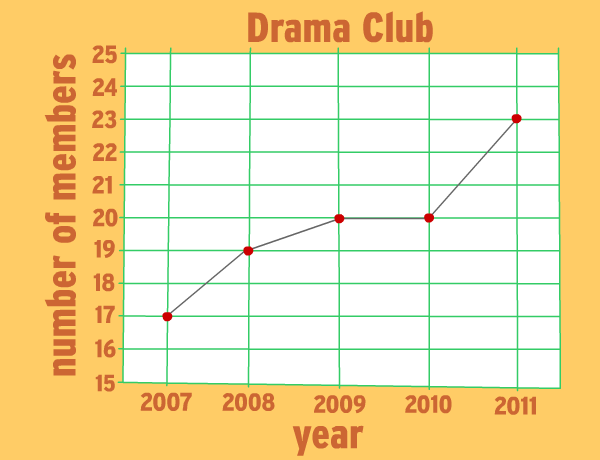 How many more members joined Drama Club in 2011 compared to 2007?
What is: 6
500
If Mr. Fjeldsted throws the football 12 times during recess and each throw goes 8 yards, how many total yards did Mr. Fjeldsted throw for?
What is: 96