Two Way Tables
Correlation
Residuals
100
 The number of males who like basketball.
What is 15?
100
The letter that describes the correlation coefficient.
What is r?
100
This is how you calculate a residual value.
What is actual y value minus expected y value?
200
The number of males who can swim
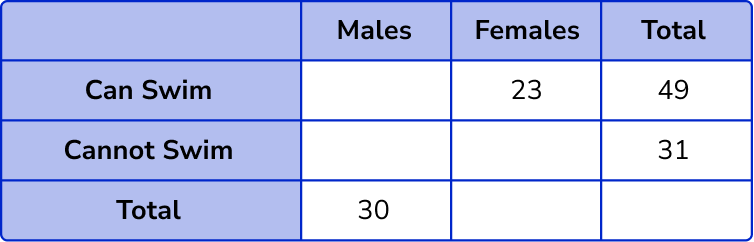
What is 26?
200
The two ways to describe correlation coefficient.
What is Strong or Weak and Negative or Positive?
200
This is where data points with positive residuals are located relative to the line of best fit.
What is above the line?
300
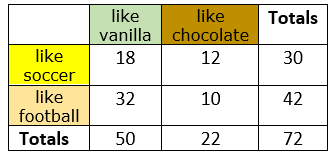
The percentage of chocolate lovers who like soccer
What is 55%?
300
The correlation coefficient of a scatter plot with the strongest possible positive correlation.
What is 1 or close to 1?
300
This is the sign and size of a residual resulting from a data point that is below and far from the line of best fit.
What is large and negative?
400
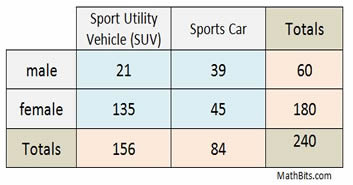 The percentage of females who drive sports cars.
What is 25%?
400
The description of of a scatterplot with r=-0.23.
What is weak and negative?
400
The residual plot of a curved scatter plot results in this.
What is a pattern?
500
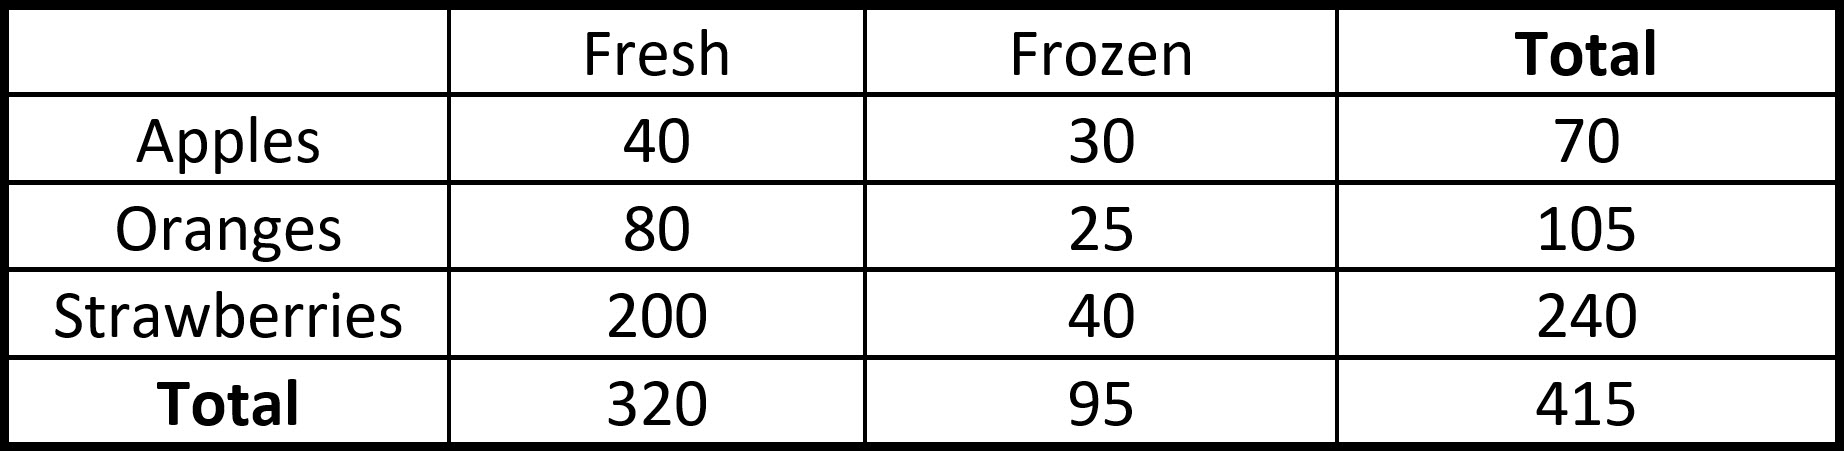
The percentage of all people surveyed who do NOT like frozen apples.
What is 93%?
500
A data set has a weak, positive correlation. This is the impact to r when a statistician collects more data and adds many data points that are close to the line of best fit.
What is r increases?
500
This is what the residual plot should look like if the scatter plot is linear.
What is no pattern, positive and negative values, or scattered?