Bar Graph
Scatter Plot
Histogram
Pie Chart
Stem Plot
100

How many people like romance movies?
6 People
100

Is the weight relative to the cost?
Yes, the higher the weight the higher the cost.
100

What is the mean of this graph
2.5
100
 How many people took the survey?
20 People
100
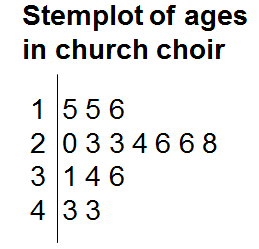
What is the percentage of choir member above the age of 20?
73.3% of the members in the coir are above 20 years old.
200
How many total people participated in the survey?
20 People
200
Are there any outliers?
No
200
What is the average frequency of people under 40
3
200
How many people like Sci-Fi movies?
4 people
200
What type of data does a stemplot display?
Quantitative Data
300

What is the range of this graph?
4 Pets
300
 Does the temperature directly affect the number of chirps.
Yes
300
How many octogenarian's are there.
0
300
True or False pie charts display qualitative data?
True
300

What is the average test score?
82.96%
400
What is the mean of this graph?
3 Pets
400
True or False, there are more than outlier in this scatter plot.
False
400
:max_bytes(150000):strip_icc()/Histogram1-92513160f945482e95c1afc81cb5901e.png) How many people chose 31-40
How many people chose 31-40
6
400
How many people like Comedy and Action movies?
9 People
400
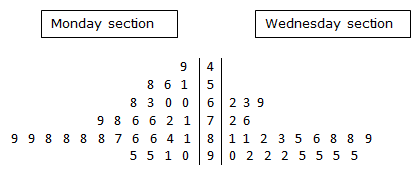
Compare the shape of the two plots?
Monday's section is slightly skewed left and Wednesday's section is strongly skewed left.
500
What is the median of the graph?
3 Pets
500
What equation do you use to find the least squares regression line?
Y=mx=b
500
How many people participated in this survey?
51 people
500

Which game do people like the most?
Candyland
500
What is the median of this plot?
82.5