Questions 1-5
Questions 6-10
Questions 11-15
Questions 16-20
Questions 21-25
100
1. A cell phone company wants to know how happy its customers are with their service. The company sent a text with a survey to every customer’s phone. Out of the 100,000 customers, 42,000 replied. Based on the 42,000 responses, they concluded that their customers were highly satisfied. What type of bias should the company be worried about?
a. Selection bias b. Response bias
c. Nonresponse bias d. Measurement bias
e. There is no need to worry since all customers received the text.
c. Nonresponse bias
100
6. Consider the following scatterplot of midterm and final exam scores for a class of 15 students. Which of the following is incorrect?
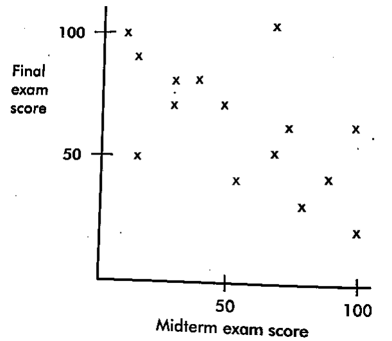
a. The same number of students scored 100 on the midterm exam as scored 100 on the final exam.
b. Students who scored higher on the midterm exam tended to score higher on the final exam.
c. The scatterplot shows a moderate negative correlation between midterm and final exam scores.
d. The coefficient of determination here is positive.
e. No one scored 90 or above on both exams.
b. Students who scored higher on the midterm exam tended to score higher on the final exam.
100
11. One thousand students at a city high school were classified both according to GPA and whether or not they consistently skipped classes.
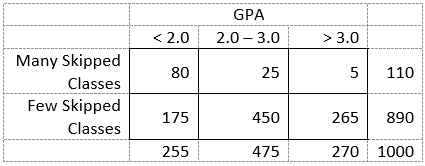
What is the probability that a student has a GPA under 2.0 and has skipped many classes?
a. 0.080 b. 0.281 c. 0.285 d. 0.314 e. 0.727
a. 0.080
100
16. Data were collected on two variables X and Y and a least-square regression line was fitted to the data. The estimated equation for this data is ![]() . What is the residual for
. What is the residual for ![]()
a. 7.91 b. 6.21 c. 0.21 d. -0.21 e. -2.91
d. -0.21
100
21. The average yearly snowfall in a city is 55 inches. What is the standard deviation if 15% of the years have snowfalls above 60 inches? Assume yearly snowfalls are normally distributed.
a. 4.83 b. 5.18 c. 6.04 d. 8.93
e. The standard deviation cannot be computed from the information given.
a. 4.83
200
2. Suppose among the 6000 students at a high school. 1500 are taking honors courses and 1800 prefer watching basketball to watching football. If taking honors courses and preferring basketball are independent, how many students are both taking honors courses and prefer basketball to football?
a. 300 b. 330 c. 450 d. 825
e. There is insufficient information to answer this question.
c. 450
200
7. Which distribution above has the smallest standard deviation?
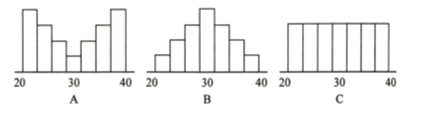
a. A b. B c. C d. It cannot be determined from the graphs
e. All three distributions have the same standard deviation.
b. B
200
12. Given the frequency distribution of the colors of cars in a parking lot, what is the relative frequency of blue cars?
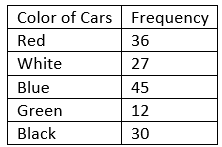
a. 0.08 b. 0.18 c. 0.20 d. 0.24 e. 0.30
e. 0.30
200
17. Which of the following is incorrect?
a. Blocking is to experiment design as stratification is to sampling design.
b. By controlling certain variables, blocking can make conclusions more specific.
c. The paired comparison design is a special case of blocking.
d. Blocking results in increased accuracy because the blocks have smaller size than the original group.
e. In a randomized block design, the randomization occurs within the blocks.
d. Blocking results in increased accuracy because the blocks have smaller size than the original group.
200
22. Two studies are run to compare the experiences of families living in high-rise public housing to those of families living in townhouse subsidized rentals. The first study interviews 25 families who have been in each government program for at least 1 year, while the second randomly assigns 25 families to each program and interviews them after 1 year. Which of the following is a true statement?
(A) Both studies are observational studies because of the time period involved.
(B) Both studies are observational studies because there are no control groups.
(C) The first study is an observational study, while the second is an experiment.
(D) The first study is an experiment, while the second is an observational study.
(E) Both studies are experiments.
(C) The first study is an observational study, while the second is an experiment.
300
3. Which are true about this histogram of test scores?
I The median score was 75.
II If the passing score was 60, most students failed.
III More students scored between 50 and 60 than between 90 and 100.
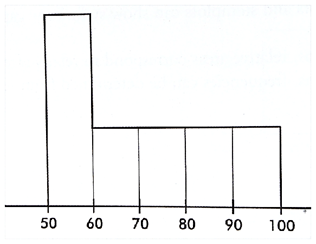
a. I only b. II only c. III only d. II and III only e. I, II, and III
c. III only
300
8. The mathematics department wants to see if the use of a software program will improve scores in geometry. The department has decided to set up a small experiment with 10 sections of geometry. Two teachers have volunteered to have their students participate in the study. Ms. Smith is going to use the software alongside existing classroom materials while Mr. Jones is going to use the current classroom materials only. Each teacher will use 5 sections of geometry taught in periods 1 through 5. The students will be given a pretest as well as a posttest at the end of the course. What are the treatments in this experiment?
a. Students taking the course b. The time of day of the course
c. The teacher d. Software or no software e. Posttest results
d. Software or no software
300
13. A political polling group is interested in learning about the proportion of registered voters who favor a particular candidate for mayor. Which of the following sample plans may have introduced bias?
a. Individuals were selected randomly to participate form a list of registered voters.
b. Every 50th person on a list of registered voters was contacted and asked to identify who they would vote for in the upcoming election.
c. A list of registered voters was first separated into two lists – one of males and one of females. Then individuals were selected at random from each of the two lists.
d. A survey was mailed to all registered voters and those who returned the survey make up the sample.
e. None of the above sampling plans creates the potential for bias.
d. A survey was mailed to all registered voters and those who returned the survey make up the sample.
300
18. One thousand students at a city high school were classified both according to GPA and whether or not they consistently skipped classes.
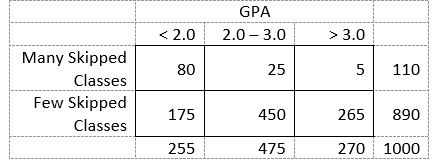
What is the probability that a student has a GPA under 2.0 given that he has skipped many classes?
a. 0.080 b. 0.281 c. 0.285 d. 0.314 e. 0.727
e. 0.727
300
23. Suppose that, in a certain part of the world, in any 50-year period the probability of a major plague is 0.39, the probability of a major famine is 0.52, and the probability of both a plague and a famine is 0.15. What is the probability of a famine given there is a plague?
a. 0.240 b. 0.288 c. 0.370 d. 0.385 e. 0.760
d. 0.385
400
4. Consider the following table of ages of U.S. senators. What is the probability a senator is under 70 years old given he or she is at least 50 years old?
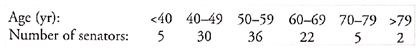
a. 0.580 b. 0.624 c. 0.643 d. 0.892 e. 0.969
d. 0.892
400
9. Which boxplots corresponds with the histogram?
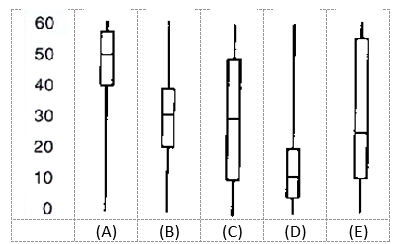
A
400
14. Based on the scatterplot, which of the following is true?
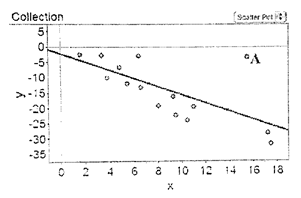
a. Point A is an outlier and a potentially influential point.
b. Point A is an outlier but not a potentially influential point.
c. Point A is not an outlier but is a potentially influential point.
d. Point A is neither an outlier nor a potentially influential point.
e. None of these are true.
a. Point A is an outlier and a potentially influential point.
400
19. Janelle collected data on the amount of time in minutes each person in a large sample of customers spent in a local store. The data also included recording the gender of each customer. These data were used to generate the boxplots shown below.
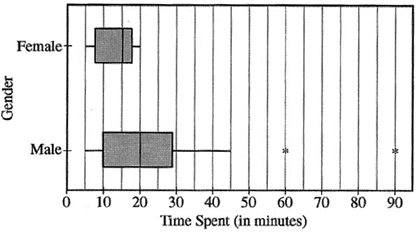
Which of the following statements is true?
a. The range in the amount of time in minutes males in the sample of customers spent in the store is approximately 40 minutes.
b. The mean amount of time in minutes males in the sample of customers spent in the store is approximately 20 minutes.
c. The third quartile of the amount of time in minutes males in the sample of customers spent in the store is approximately 45 minutes.
d. The interquartile range of the amount of time in minutes males in the sample of customers spent in the store is 15 minutes.
e. Approximately half of the males in the sample of customers spent at least as much time in the store as any female in the sample of customers.
e. Approximately half of the males in the sample of customers spent at least as much time in the store as any female in the sample of customers.
400
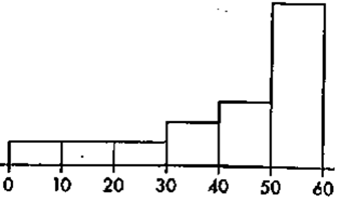
24. A random sample of 25 households from Mountainveiw School District was surveyed. In this survey, data were collected on the age of the youngest child living in each household. The histogram below displays the data collected in this survey.
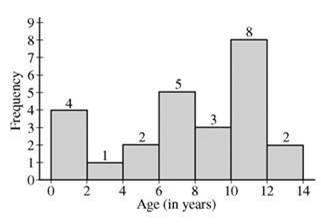
In which of the following intervals is the median of these data located?
a. 0 years old to less than 2 years old
b. 4 years old to less than 6 years old
c. 6 years old to less than 8 years old
d. 8 years old to less than 10 years old
e. 10 years old to less than 12 years old
c. 6 years old to less than 8 years old
500
5. The most appropriate graph to display data collected to show the relationship between the number of TV’s and the number of people in a group of randomly selected households is
a. A cumulative frequency plot. b. A bar chart
c. A scatterplot d. A back-to-back stem-and-leaf plot
e. A histogram
c. A scatterplot
500
10. A researcher planning a survey of heads of households in a particular state has census lists for each of the 23 countries in that state. The procedure will be to obtain a random sample of heads of households from each of the countries rather than grouping all the census lists together and obtaining a sample from the entire group. Which of the following is an incorrect statement about the resulting stratified sample?
a. It is not a simple random sample.
b. It is easier and less costly to obtain than a simple random sample.
c. It gives comparative information that a simple random sample wouldn’t give.
d. A cluster sample would have been more appropriate.
e. Differences in country sizes could be taken into account by making the size of the random sample from each country depend on the proportion of the total population represented by the country.
d. A cluster sample would have been more appropriate.
500
15. Consider the following back-to-back stemplots comparing car battery lives (in months) of samples of two popular brands.
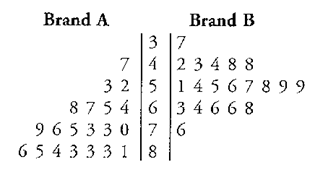
Which of the following are true statements?
I. The sample sizes are the same. II. The ranges are the same.
III. The variances are the same. (Hint: ![]() )
)
IV. The means are the same. V. The medians are the same.
a. I and II only b. I and IV only c. II and V only d. III and V only
e. I, II, and III only
a. I and II only
500
20. In which distribution(s) would you be more likely to find the mean and median the same?
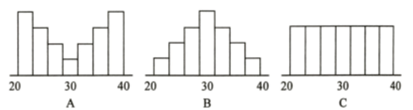
a. A only b. B only c. C only d. A & B only e. A, B, & C
e. A, B, & C
500
25. High levels of cholesterol in the blood increase the risk of heart disease. For 14-year-old boys, the distribution of blood cholesterol is approximately Normal with a mean of 170 milligrams of cholesterol per deciliter of blood (mg/dl) and a standard deviation of 20 mg/dl. Which equation could be used to solve for the 30th percentile of this distribution?
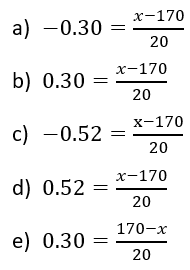
c. ![]()