Chicken Nuggets
Pizza
Doughnuts
Hot Fries
100
What is data?
Data is information.
100
What are bar graphs and line plots used for?
To organize and represent data.
100
How many people said that action movies are their favorite type of movie?
5 people
100
How many third graders like soccer?

20 third graders.
200
How many more people said that romance movies are their favorite type of movie than the people who said comedy movies?
2 people
200
What is the most frequent favorite sport among fourth graders?
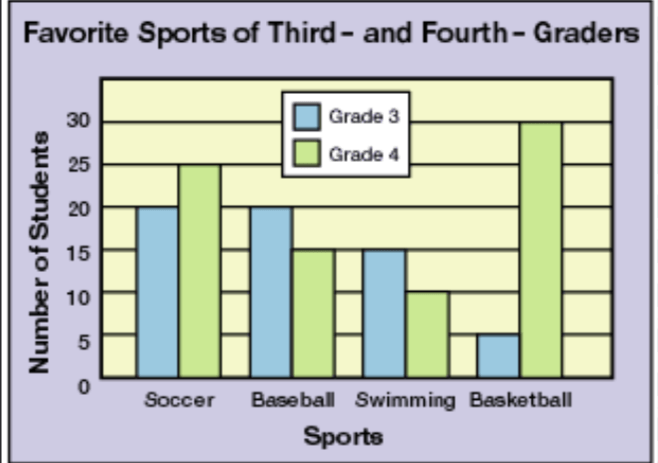
Basketball
200
What is the difference between the number of fourth graders who like soccer and the number of third graders who like swimming?

10 students.
200
What is true about the number of people who like comedy movies and the number of people who like scifi movies?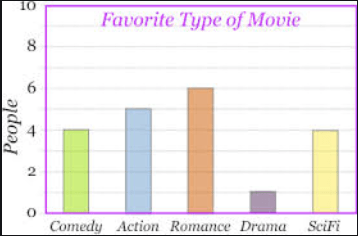
They are the same amount of people, 4 people.
300
How many third graders were surveyed in all?

60 third graders
20+20+15+5= 60
300
At the family reunion, how many females were there?
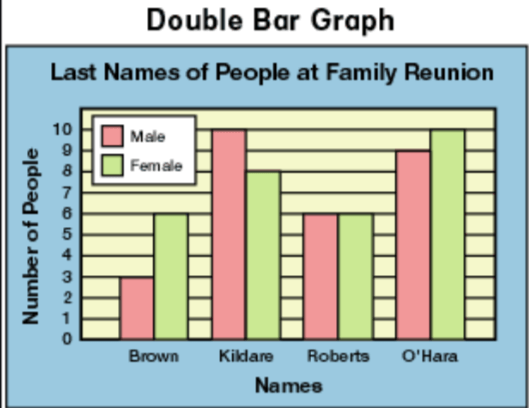
30 females
6+8+6+10= 30
300
What is the difference between the males who had the last name Kildare and the females who had the last name Roberts?

4
10-6= 4
300
Among the females, what was the most frequent last name at the family reunion?

O'Hara
400
If each "X" represents 1 person, how many people went to the mall last month?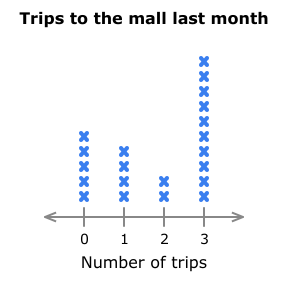
16 people
4+2+10= 16
400
If each "X" represents 1 student, how many students ate 5 candy bars or more?

9 students
4+2+1+2= 9
400
If each "X" represents 1 person, how many people went to the mall fewer than 2 times last month?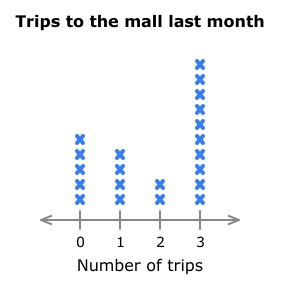
9 people
5+4= 9
400
If each "X" represents 1 student, how many more students ate candy bars than students who did not?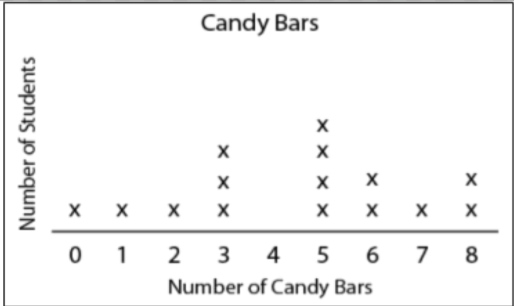
13 students
14-1= 13
500
Which day of the week is most popular for selling cars?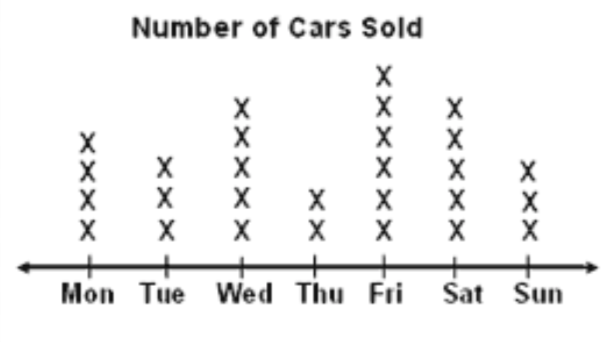
Friday
500
Which day of the week is least popular for selling cars?

Thursday
500
If each "X" represents 2 cars sold, how many cars were sold on Saturday and Sunday combined?
16 cars
(2x5)+(2x3)= 16
500
If each "X" represents 1 car, how many more cars were sold on Wednesday than on Monday?
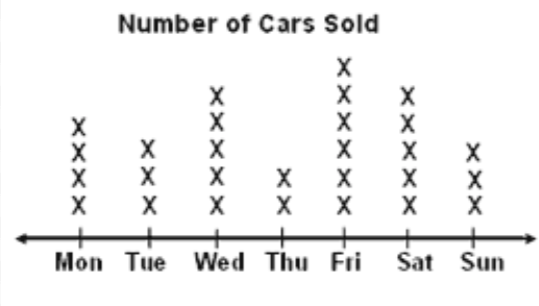
1 car
5-4= 1