Dot Plots
Histograms
Measures of Center and Spread
Box Plots
Mixed
100
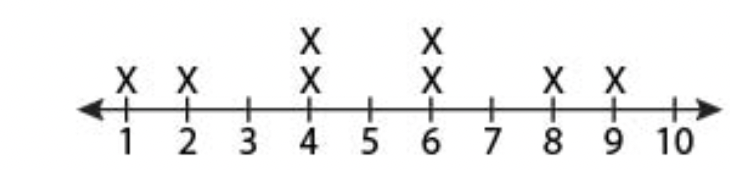
The range for the data shown in the dot plot below.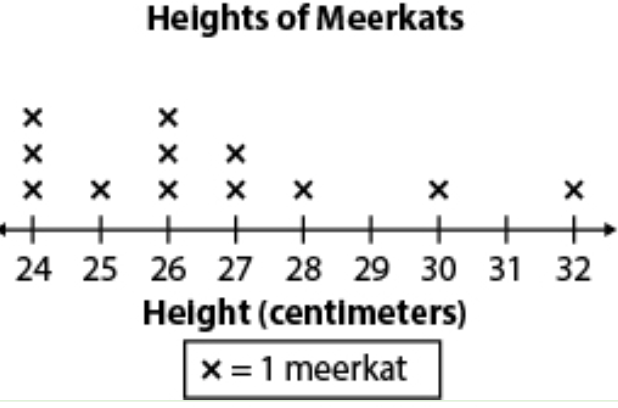
8
100
The number of customers that are between 18-44 years old.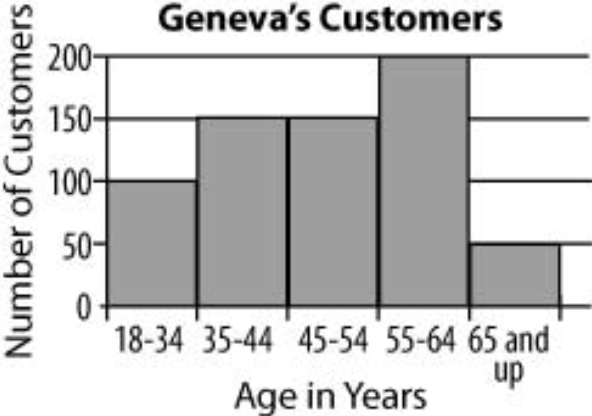
250
100
Janice took a survey of some of her classmates to find how many times in the past month each had gone to the movie theater. Her results are as follows:
0, 1, 3, 2, 1, 0, 1, 4, 3, 1, 0, 3, 4, 0, 1, 2, 2, 1
What is the MODE of the data set Janice has compiled?
1
100
What is the median of the data set shown in the box plot below?

5
100
How do you calculate the IQR?
Q3 - Q1
Subtract the median of the lower half of the data from the median of the upper half of the data.
200
The mode in the data set shown in the dot plot below.
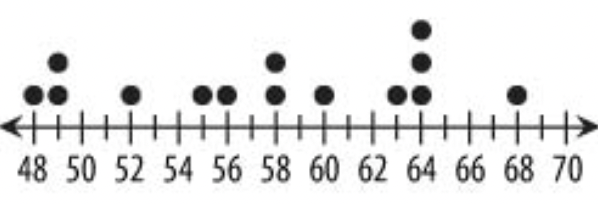
64
200
The mode shown in the histogram below.
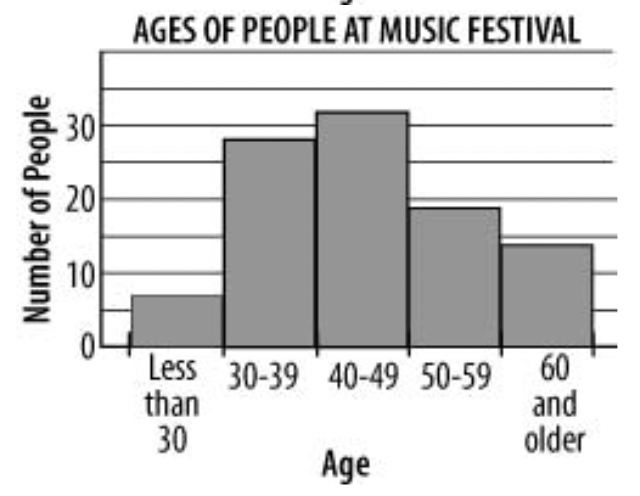
Ages 40-49
200
Alin's test scores are shown below.
85 88 90 77 82 85 82 90 95 82 85
What is the MEDIAN of his test scores?
85
200
What is the upper quartile (Q3) in the data set shown in the box plot below?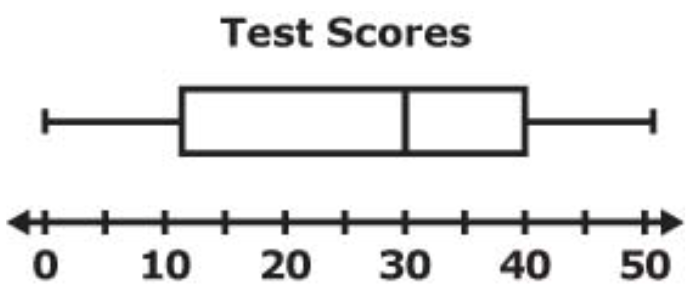
40
200
Where is the median of the data below show within the dot plot?

approx 54.21
300
The line plot below shows the results for a dice that was rolled during an experiment. What is the median?
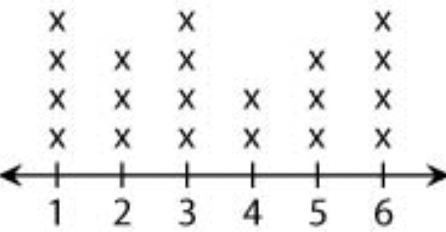
3
300
How many people are represented in the histogram below.
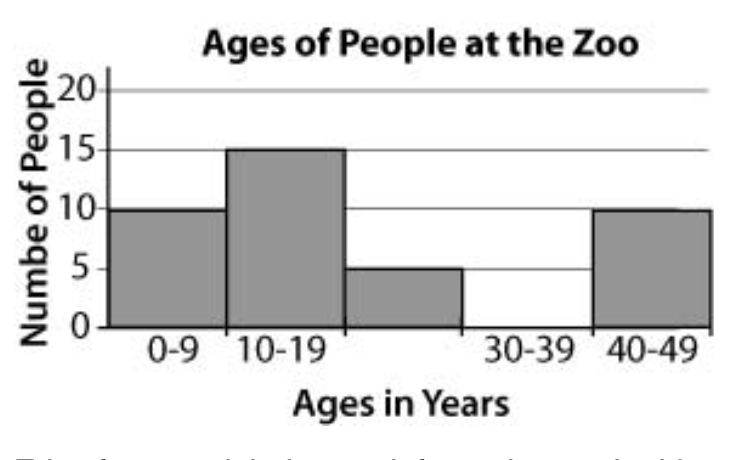
40
300
What is the MEDIAN of the following data set?
6, 3, 4, 0, 7, 6, 1, 2, 9, 8, 7, 9, 7, 3, 7, 4, 6, 7, 0, 4, 3, 7, 0
approx 4.78
300
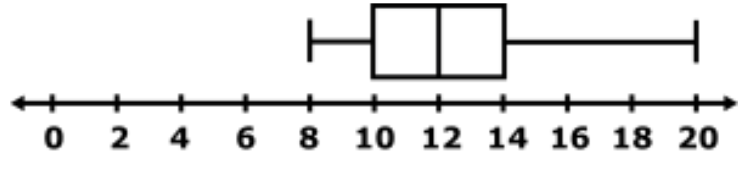
What is the interquartile range of the data set shown in the box plot below?
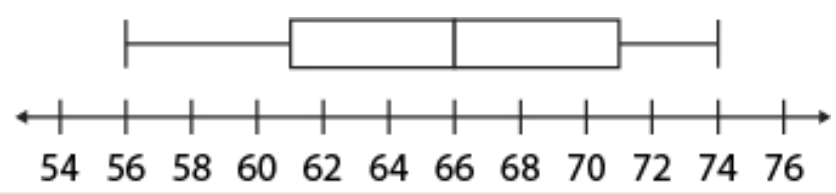
10
300
Is the data symmetric or skewed and are there any outliers?
Symmetric and no outliers
400
The mean for the data shown in the line plot below.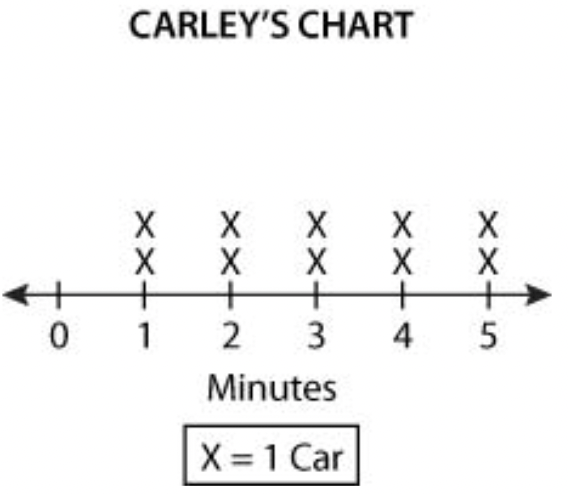
3
400
How many more students scored between 90-99 than 80-89 on the math test?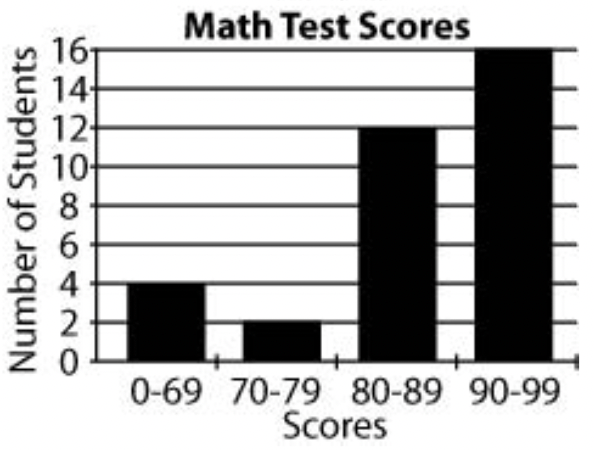
4
400
Name all four measures of central tendencies used for statistical data calculations.
mean, median, mode and range
400
What percentage of teachers representation is found between 60 and 72 inches tall?
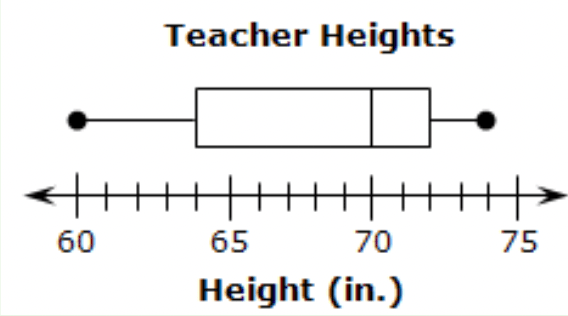
75%
400
Find the mean, median, mode and range of the following data set and identify any outliers:
0, 12, 8, 5, 24, 11, 2, 26, 21, 19, 13, 21, 0, 1, 7, 68, 25, 9
Mean: approximately 15.1
Median: 11.5
Mode: 0, and 21
Range: 68
Outlier: 68
500
How are the mean and median of the data set shown below related?

They are the same, 5
500
What makes a histogram a histogram versus a bar graph?
Bars are represented by a range of values versus just one fixed value.
500
How do the mean, median, and mode of the list below relate to one another?
3, 1, 3, 5, 4, 2
They are all equal, 3
500
What is the interquartile range (IQR) of the data set shown in the box plot below?
4
500
Give the 5 number summary with the values below.
4, 1, 15, 6, 4, 8, 5, 10, 1
Minimum: 1
First Quartile: 2.5
Median (2nd Quartile): 5
Third Quartile: 9
Maximum: 15