Measures of Center
Center from Displays
Measures of Spread
100
What is the median of this data set?
6, 8, 2, 10, 4
6
100
What is the mode of the dot plot below?
0 hours
100
What is the range of the data set below?
51, 54, 56, 48, 67, 59, 61, 63, 64
67 - 48 = 19
MAKE SURE YOUR LIST IS IN ORDER!
200
What is the mean of this data set?
3, 7, 6, 5, 10
6.2
200
Calculate the median of the dot plot below.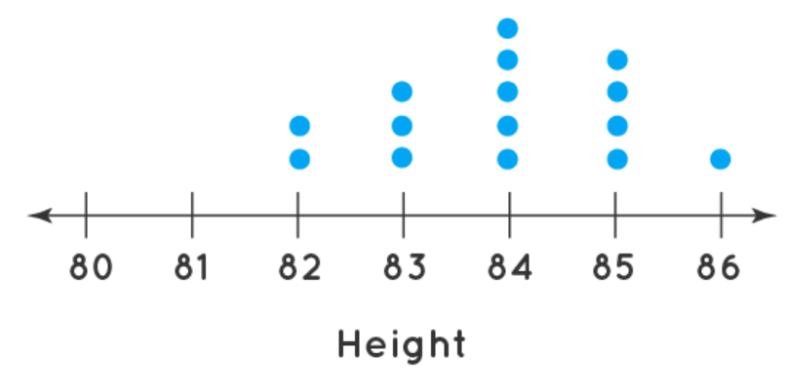
84
200
Which dot plot has a larger variability?
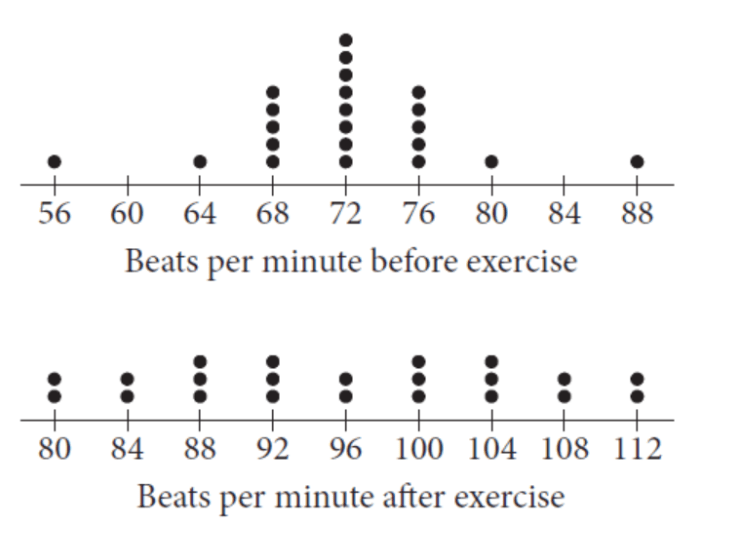
After Exercise (bottom graph)
300
Haley wants to bring up her grade in biology. She got a 87, 79, and a 92 on the first three quizzes. What would she need on the last test to bring up her quiz average to a 90?
102 (extra credit???)
300

Group A
300
Which team has the greater the IQR?
Spurs
400
Find missing value using the information below.
13, 16, 17, 4, 7, x
mean = 10
x = 3
400
Did anyone score an 85?
We are unsure.
400
A new student joined the class and reported that he read 20 books over the summer. If he is added to the dot plot below, what would the mean be for the new data?
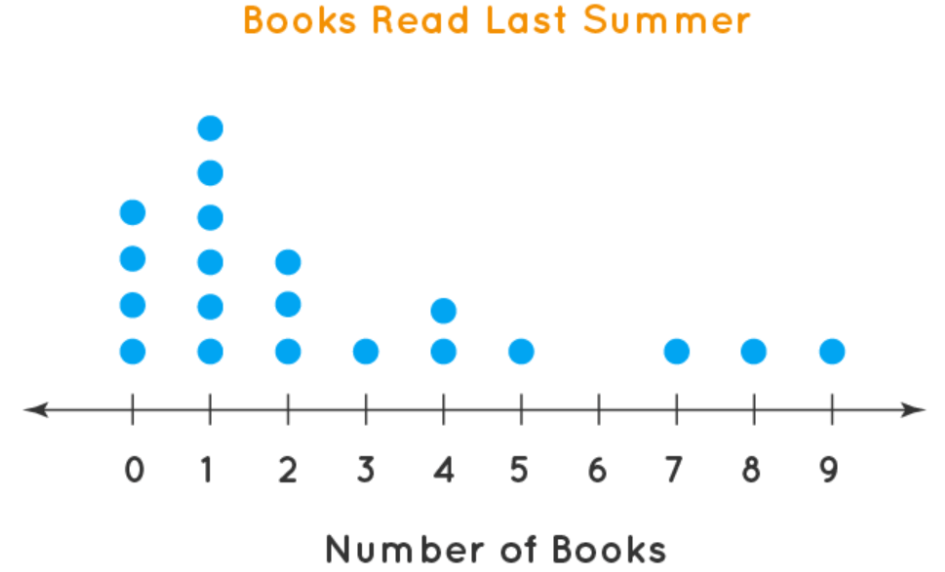
about 3 books
500
The average of the data values below is 10. Solve for x.
2x, 5x-1, 6, x+3
x=4
500
Which shop has the greatest variability in prices?

Shop A
500
The frequency table below includes data on the number of pets owned by students in Mr. Johnson's class. A new student joins the class and reports that they own 10 dogs. How would the new student affect the range of the data set? Explain why!
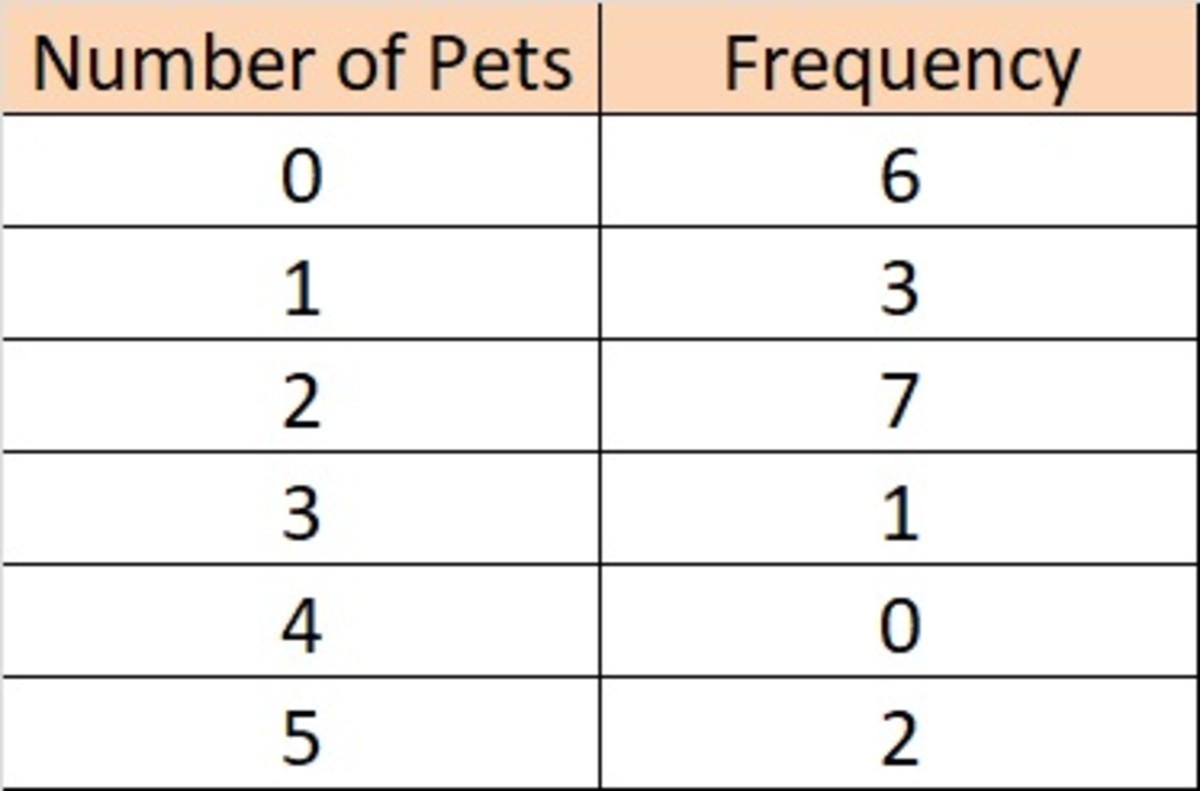
The range would increase because the data is becoming more spread out.