Mode
Mean
Median/IQR
Describing Data Distributions
Which is the best measure of central tendency?
100
The mode of 3, 5, 7, 9, 2, 3, 5, 9, and 3
What is 3?
100
The mean of 5, 2, 12, 7, 13, 9, and 8
What is 8
100
The median of 7, 5, 4, 6, 8, 3, 5, 2, 5
What is 5?
100
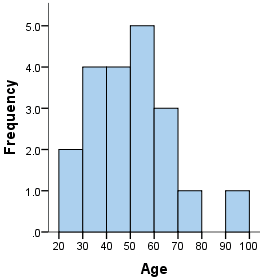
 What is the peak of the ages
Between 50-60 years old
100
Is the mean or median more affected by outliers?
mean
200
Is there a mode for the dot plot, if so how many?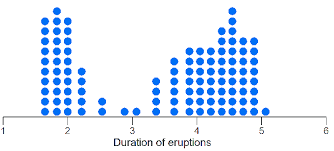
Yes, 2 modes
200
The mean of 92, 88, 84, 86, and 88.
What is 87.6?
200
The median of 5, 2, 12, 7, 13, 9, 8, 13
What is 8.5?
200
 Is the data skewed? If so, which side?
Yes, it is skewed to the left
200
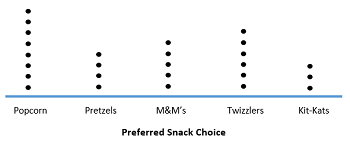 Which is the best measure of central tendency for the dot plot?
The Mode (categorical data, not numeric)
300
What is the mode of the dot plot?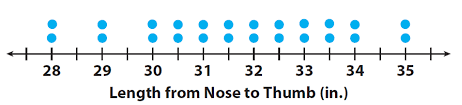
no mode
300
What is the mean of the given data?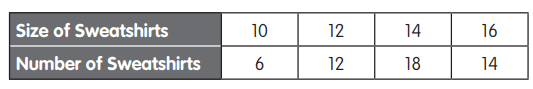
Mean is 13.6 sweatshirts
300
What are the median and Inter Quartile Range of the data set...
35, 21, 34, 44, 36, 42, and 29
Median is 35 and IQR is 13
300
 Is the data symmetric or not symmetric?
Not symmetric
300
Which is the best measure of central tendency and variance for the following data set...
11, 9, 8, 10, 14, 13, 17, 63, 18, 17, 17, 14, 9, 10
Median (outlier at 63)
400
The mode of 30, 42, 42, 31, 49, 59, 59, 66, 41, 35, and 99
Mode = 42 & 59
400
Kira's mean score for 4 quizzes is 8. His scores for the first three quizzes are 7.5, 8, and 9. What is Kira's score for the last quiz?
The last quiz score is 7.5
400
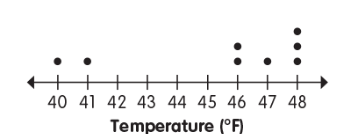
What is the median temperature?
46.5 degrees Fahrenheit
400
 How many data points were collected?
20 data points
400
In a symmetric distribution, how are the mean and median related?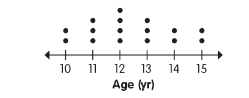
mean is 12.375, median is 12
They are very close, and both good representations of the data set.
500
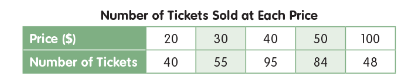
What is the mode?
$40
500
Jon's mean score for 5 video games is 7,500 points. How many points must he score in the sixth game for his mean score to become 7,700 points?
8,700 points
500
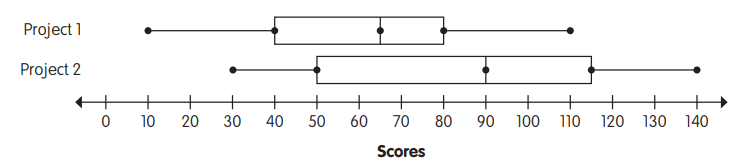

Since the interquartile range of Project 1 is less than that of Project 2, Noah’s scores in the middle half of Project 1 is less spread out than those of Project 2. So, Noah’s Project 1 has a less variability in the scores.
500
What are the range and mode of the data?
Range = 80, Mode = 50 to 60
500
John is trying to convince his teacher that the class gets too much homework. He recorded the average amount of homework , in minutes, that his classmates have a night...
45, 96, 30, 28, 50, 38, 30, 30, 45
Find the mean, median, and mode.
Which measure would best suit John's desire to prove the students have too much homework
Mean = 43.6 , Median = 38, Mode = 30
Should use the MEAN since it is higher.