DEFINITIONS
Mean, Etc.
Median and Mode
Range and IQR
Miscellaneous
100
The difference between the largest and the smallest values
What is range?
100
Find the mean.
13, 18, 13, 13, 14, 21, 13
What is 15?
100
Find the median and mode:
13, 18, 13, 14, 13, 16, 14, 21, 13
median: 14
mode: 13
100
Find the range.
Ages of Animals (years)
13, 18, 13, 14, 13, 16, 14, 21, 13
What is 8 years?
100
Is this a statistical question? Explain.
How many shoes do you have?
Yes, it is a statistical question. It has more than one correct answer. If you ask more than one person, you're going to get more than one answer.
200
The value that occurs most often
What is mode?
200
Find the mean.
8, 9, 0, 7, 0, 8
What is 5.3 or 5 1/3?
200
On a state licensing test, Jean and her friends got the following scores: 65, 78, 63, 78, 97, 42, and 53. What was their median score?
What is 65 points?
200
Find the range and IQR of this data.
Number of M & M's in a package.
12, 13, 13, 15, 10, 11, 11, 11, 10, 9
Range: 6 M & M's
IQR: 3 M & M's
200
What is the shape of the plot. What percent of the rebounds were 5 or more? 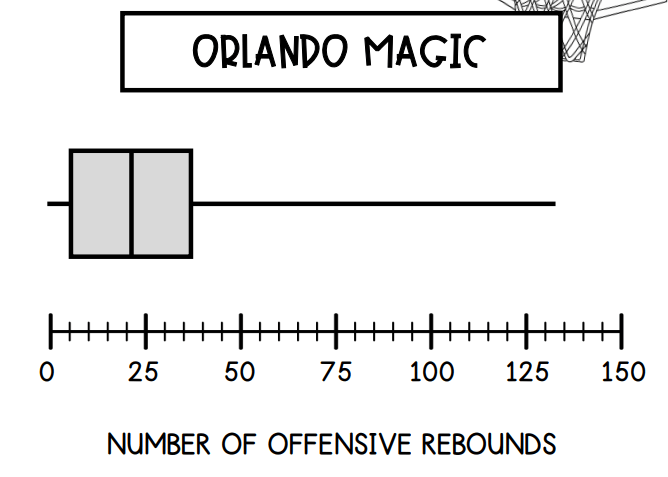
skewed right
75%
300
First, list the numbers in numerical order. Find the middle number. If there are two middle numbers, find the middle of the two numbers.
What is median?
300
The line plot the number of inches of rainfall over 18 days. What is the average (mean) number of inches of rainfall recorded? Round to the nearest 10th.
What is $2.4 inches
300
Name the 5 number summary for this box and whisker plot. Give the name of the point with its number.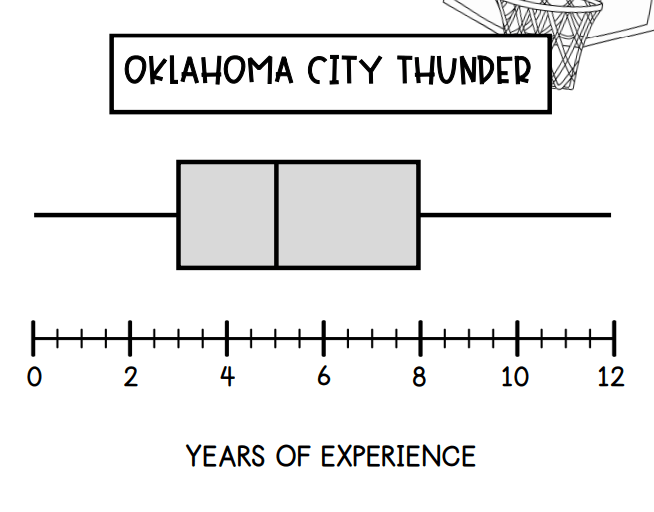
minimum or lower extreme: 0 years
first quartile or lower quartile: 3 years
median: 5 years
third quartile or upper quartile: 8 years
maximum or upper extreme: 12 years
300
Find the range and the interquartile range. 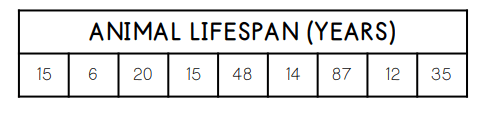
Range: 81 years
IQR: 28.5 years
300
Describe the shape of the histogram. How many runners ran less than three miles?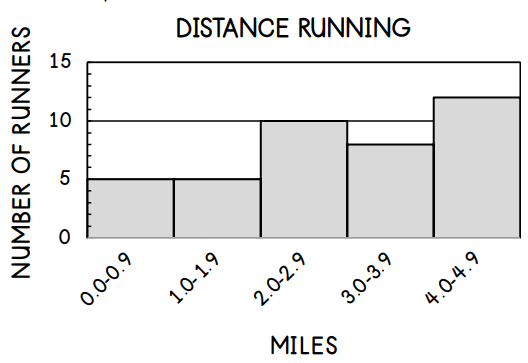
skewed left; 20 runners
400
Name two types of graphs that are useful for large amounts of data.
Name three types of graphs that show the spread of the data.
large amounts of data:
box and whisker plots, histograms
Spread of data:
box and whisker plots, dot plots, histograms
400
Find the five number summary.
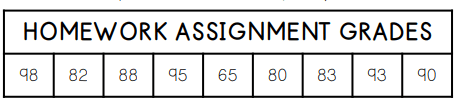
minimum: 65
first quartile: 81
median: 88
third quartile: 94
maximum: 98
400
Find the median and mode.
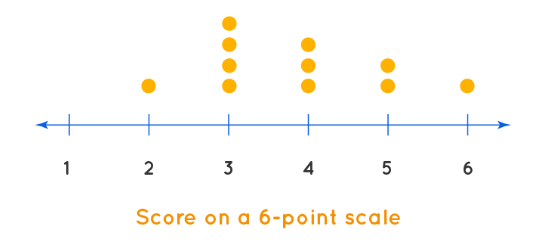
Median: 4 points
Mode: 3 points
400
Find and interpret the range and IQR.
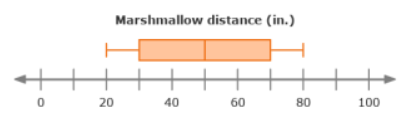
Range: 80-20= 60 inches
The distances vary by no more than 60 inches.
IQR: 70-30 = 40 inches
The middle 50% of the distances vary by no more than 40 inches.
400

What percent of the data is at most 4 pies?
50%
500
Add up the set of numbers and divide by the total number of values
What is mean?
500
 Find the 3 measures of center and explain which is best to describe the data set and why.
Mean: 2
Median: 2
Mode: 2 The mean is always the best measure of center unless there is an outlier. In this case, there is not.
500
Find the median and mode of the line plot and explain the shape of the data, including if there are any striking deviations (outliers)
Median: 2.5
Mode: 3
Shape: Skewed Right with a gap from 5-8 and a peak at 3. The outlier is 9.
500
Find and interpret the range and the interquartile range.
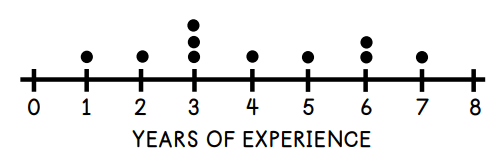
Range: 6 years
The data varies by no more than 6 years.
Interquartile Range: 3 years
The middle 50% of the data varies by no more than 3 years.
500
Find the mode, median, minimum, and maximum of the data.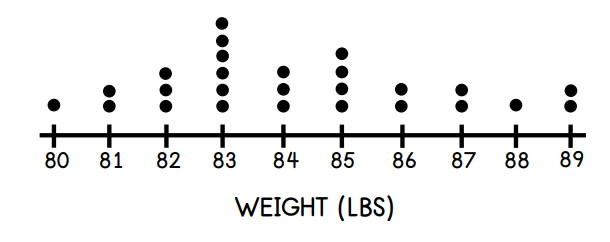
mode: 83
median: 84
minimum: 80
maximum: 89