Descriptive Statistics
Classifying Variables
Comparing two means
Linear model
Correlations and Chi-squared
Miscellaneous
100
What measure of central tendency is the average of the data?
What is the mean
100
What is the most precise level of measurement?
What is ratio
100
What are the null and alternative hypotheses for independent t-tests?
What is H0-There is no mean difference between groups and Ha: There is a mean difference between groups.
100
What are the required assumptions for simple linear regression?
What is linearity and additivity, uncorrelated errors, homoscedasticity, and normality of errors.
100
This type of statistical analysis measures the relationship between two variables and ranges from +1 to -1.
What is correlation.
100
When a researcher identifies there is no statistically significant difference between two variables or groups when in fact one exists. Also know as erroneously failing to reject the null hypothesis, this type of error has occured.
What is Type II error.
200
What measure of central tendency is the most frequent value within the data set?
What is the mode?
200
Continuous variables include variables measured using what two levels of measurement?
What are interval and ratio levels of measurement.
200
What are the assumptions for paired t-test?
What is independence, adequate sample size, normality of the differences between groups, no extreme outliers, and dependent variable should be continuous.
200
This coefficient in the linear equation measures the association between a predictor variable and the outcome variable.
What is b1
200
When assumptions for Pearson's correlation are not met what are the nonparametric alternatives that can be used instead?
What is Spearman's correlation or kendal's tau.
200
Calculate the mean and mode of the data set below.
25, 50, 100, 75, 40, 40, 60, 80, 95, 110
What is 67.5 for the mean and 40 for the mode.
300
Which measures of central tendency are not influenced by outliers within the data?
What is the mode (most frequently occurring number in the data set) and the median (middle number within the data set).
300
Categorical variables are measured using which two levels of measurement?
What are nominal and ordinal levels of measurement.
300
This analysis requires two variables for each participant a categorical variable to designate the group and a continuous variable that contains the outcome variable.
What is independent t-test.
300
Based on the SPSS output below what is the best fit line?
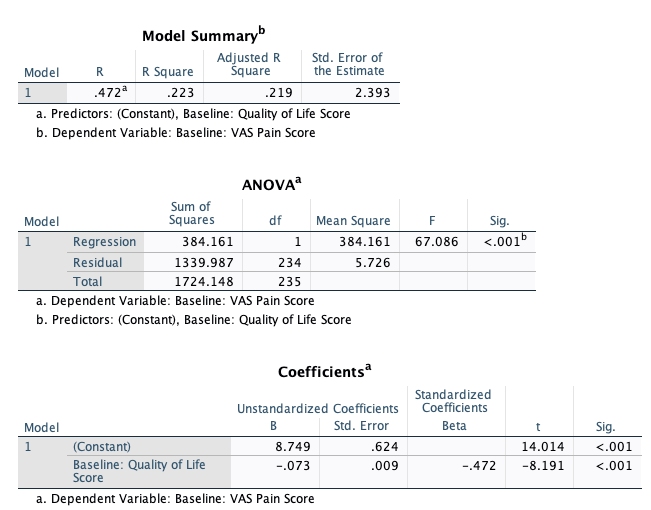
What is Y= 8.749 -0.073X
300
If a research identifies a correlation between average calcium intake and hair growth (r = .95, [.98-.90], p=0.002). Would the researcher be able to claim increasing calcium will increase hair growth?
What is no correlation does not equal causation. Instead the researcher could state there is a positive correlation between calcium intake and hair growth.
300
Calculate the standard deviation for the following set of numbers.
25, 50, 100, 75, 30, 40, 60, 80, 95, 110
What is 30.10.
To calculate SD you must calculate the mean ((25+50+100+75+30+40+60+80+95+110)/10) which is 66.5.
Then subtract the mean from each value in the data set and square the result.
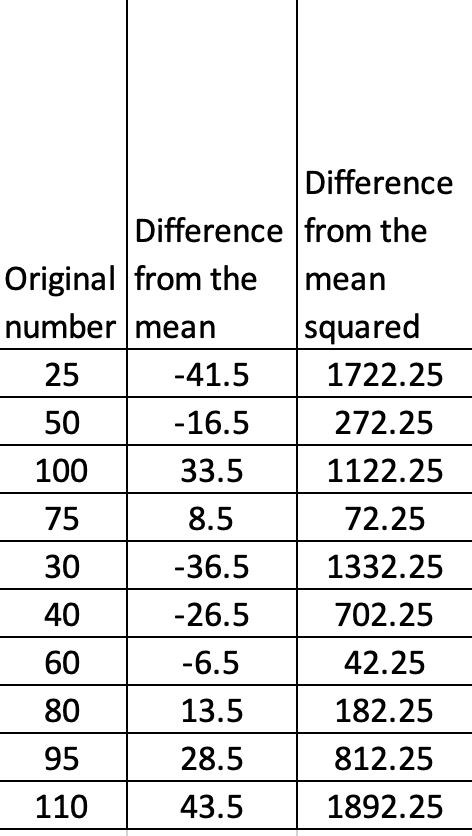 Then find the sum of the squared mean differences (column 3) which equals 8152.5.
Divide the sum of the squared mean differences (8152.5) by n-1 or 9 = 905.83
Take the square root of 905.83 =30.097
400
This measure of variability indicates the dispersion of numbers within a variable.
What is the standard deviation
400
Temperature is an example of what level of measurement?
What is interval.
400
What are the assumptions for independent t-tests
What is independence, adequate sample size, normality, homogeneity of variance and dependent variables should be continuous.
400
Based on the SPSS output below what is the proportion of the variance in the dependent variable?

What is 22.3%.
400
What are the assumptions to conduct a chi-squared analysis?
What is independence, and expected frequencies should not be below 5.
400
What is the difference between mediation and moderation?
Mediators explain the process through which the independent and dependent variables are related. Moderators influence the strength and direction of the relationship between the independent and dependent variable(s).
500
Variance measures the spread between numbers in a data set.
What is the variance in participant heights if you know the standard deviation is 12.5?
What is 156.25. Variance is calculated by squaring the standard deviation of a data set.
500
Income is an example of what level of measurement?
What is ratio.
500
A researcher is interested in understanding the influence of attending tutoring sessions on overall exam scores. The researcher collects pre and post data for exams in students in one section of a statistics course. What is the best statistical test to analyze this data.
What is paired t-test.
500
Researchers conducted a study evaluating the influence of age (in years) on overall quality of life scores (measured in points from 1-100 with higher scores indicating better quality of life). The researchers derived a quality of life estimation formula using simple linear regression: quality of life = 20.5 + 3.5(age in years). The estimated Pearson correlation coefficient was .85(95% CI .95-.80). What is the slope of the regression line?
What is 3.5, for every year increase in age overall quality of life scores increase by 3.5 points.
500
What are the nonparametric alternatives to chi-squared analysis?
What is Fisher's exact test.
500
What is the difference between statistical significance and clinically relevant?
What is statistically significant data are determined using inferential statistics and hypothesis testing while clinically relevant data may or may not be statistically significant but rather demonstrate a meaningful outcome based on the clinical condition being studied.
600
Range is the span of the data set. What is the range of the dataset below.
130, 118, 165, 190, 75, 200, 95, 115, 135, 150
What is 75-200 or 125. Range can be represented as the minimum number through the maximum number (75-200) or can be calculated by subtracting the minimum from the maximum (200-75= 125).
600
Eye color and hair color are examples of what level of measurement?
What is nominal.
600
When comparing mean differences between independent groups and assumptions for the independent t-test or paired t-test are not met what nonparametric tests should be used?
What is the Mann Whitney U test and the Wilcoxon signed rank test.
600
When reviewing a graph of ZRESID plotted against ZPRED what assumption is being validated?
What is homogeneity of variance.
600
This type of statistical analysis compares the association between two categorical variables.
What is chi-squared test.
600
If a researcher identifies a statistically significant difference between two variables or groups when in fact there is no difference. Also know as erroneously rejecting the null hypothesis, this type of error has occured.
What is Type I error.