Independent/Dependent
Independiente dependiente
Independiente dependiente
Name the independent and dependent variable.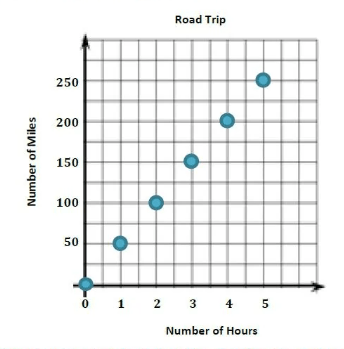
Independent variable: number of hours
Dependent variable: number of miles
Determine whether each relationship represents a function. Explain your reasoning.
NO - explanations may vary
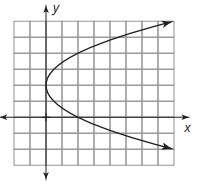
Identify the domain and range (include units)
R)distance from home (miles)
What is the correlation coefficient rounded to the nearest hundredth?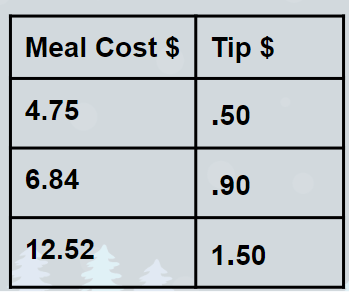
0.99
Rhonda deposited $3000 in an account in the Merrick National Bank, earning 4.2% interest, compounded annually. She made no deposits or withdrawals. Write an equation that can be used to find B, her account balance after t years.
B = 3000(1.042)t or B = 3000(1 + 0.042)t
Angela’s grandfather gave her all the cash he had in his pocket to buy raffle tickets that cost $1 each for her cheerleading fundraiser. Identify the independent quantity and dependent quantity in the problem situation.
D) amount of raffle tickets purchased
I) amount of money angela has
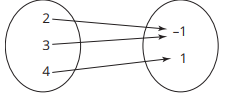
Determine whether each relationship represents a function. Explain your reasoning.
yes - explanations may vary
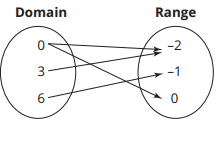
identify the domain and range

D) 2, 3, 4
R) -1, 1
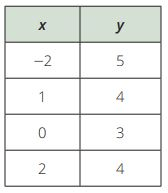
What is the linear regression equation for the set of data given rounded to the nearest whole number?

y=-621x + 11821
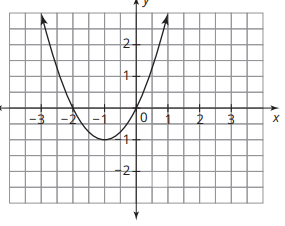
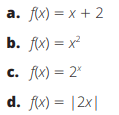
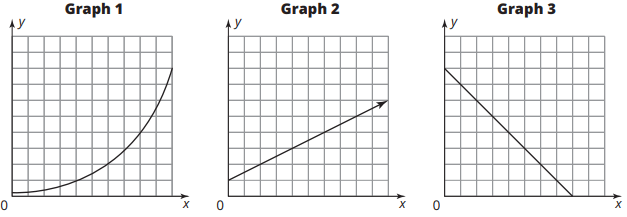
Match the function to its graph
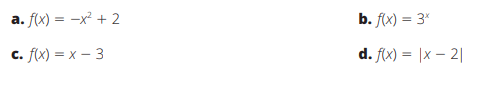
d
Brie knows there is a relationship between the grades on her math tests and the time she spends studying for those tests. Identify the independent quantity and the dependent quantity in this problem situation
D)grade on math test
I) amount of time spent studying
Determine whether each relationship represents a function. Explain your reasoning.
yes explanations will vary
Michelle incorrectly says that this is not a function because the -1 repeats. Explain why she thinks this (use the terms domain and range in your answer)
Write the linear regression equation, then write the correlation coefficient rounded to the nearest tenth.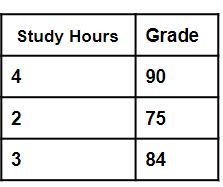
linear regression equation: y=7.5x+60.5
correlation coefficient: 1
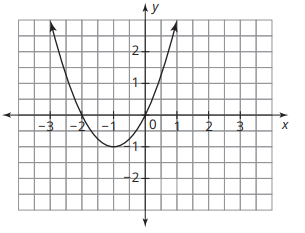
Sketch a graph that has the given characteristics.
• is a function
• is quadratic
• is continuous
• has an absolute maximum
answers will vary
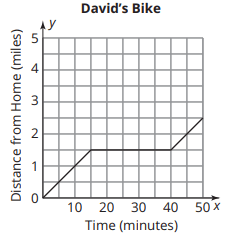
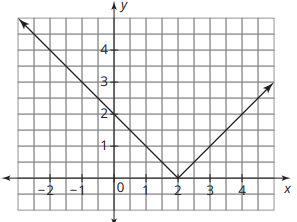
David rode his bike to the park. After staying at the park for a while, he continued his ride to the grocery store. The graph shown represents this situation. Identify the independent and dependent values - include units in your answer.
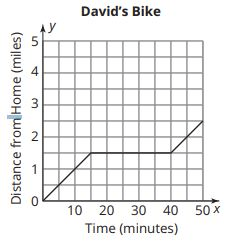
D)distance from house (miles)
I) time(in min)
Determine whether each relationship represents a function. Explain your reasoning.
no explanations will vary
what is the domain?

all real numbers
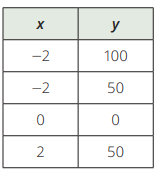
Write the linear regression equation for the set of data given.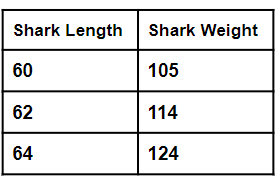
y = 4.75x - 180.167 or y = 4.75x + (-180.167)
which is a linear function?
a
The current population of a town is 10,000. If the population, P, increases by 20% each year, which equation could be used to find the population after t years?
1) P = 10,000(0.2)t 2) P = 10,000((0.8)t
3) P = 10,000(1.2)t 4) P = 10,000((1.8)t
3) P = 10,000(1.2)t
Determine whether each relationship represents a function. Explain your reasoning.
no explanations will vary
what is the range?
all values of y greater or equal to -1
Which characteristics best describe the graph?
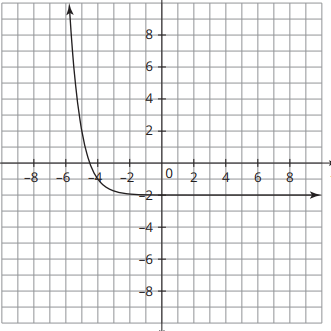
a. is a function is exponential is discrete is increasing
b. is a function is exponential is continuous is decreasing
c. is a function is a linear absolute value function is discrete is increasing
d. is a function is a linear absolute value function is continuous is decreasing
b. is a function is exponential is continuous is decreasing
Heath has 10 pennies in his piggy bank initially. He doubles the number of pennies in his piggy bank each day for five days. Which graph correctly represents the scenario. Lablel the x and y axis (include units)
graph 1
x axis = time (in days)
y axis = number of pennies