Linear Models
Quadratic Models
Exponential Models
Which one?
100
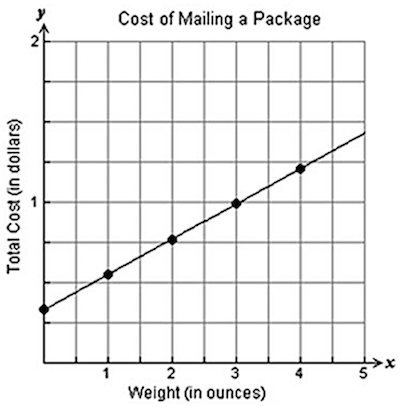
Which of these graphs shows a linear function?

The last one
100
Which of these graphs shows a quadratic function?
The first one
100
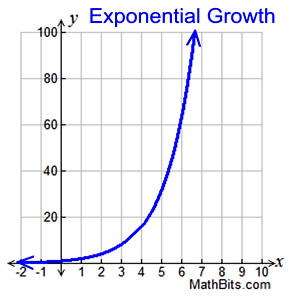
Which of these graphs shows a exponential function?
The second one
100
If the x-variable is time (s) and the y-variable is distance in (m), what is an appropriate term for the rate of change?
seconds per metre
200
In order to calculate if a function is linear, we have to look at the _______?
First Differences
200
In order to calculate if a function is quadratic, we have to look at the _______?
Second Differences
200
In order to calculate if a function is exponential, we have to look at the _______?
Ratios
200
Determine if this data belongs to a function that is linear, quadratic or exponential.
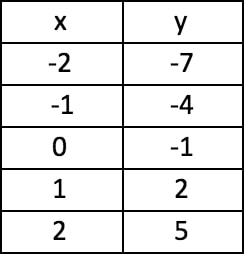
Linear because the first differences are the same.
300
True or False.
A linear relationship implies different changes over equal intervals.
False.
A linear relationship implies equal changes over equal intervals.
300
Is the rate of change for this function increasing or decreasing?

Decreasing
300
True of False
In an exponential relation, there is a constant percent increase over equal intervals.
True
300
True or False
This table of values shows the data of a quadratic function.

True
400
If the line of best fit for a linear function is y=3x + 5, predict what the function will be at x=20
y=3(20) + 5
y=60 + 5
y=65
400
If the curve of best fit for a quadratic function is y=3x2+2x+5, predict what the function will be at x=4
y=61
400
If the equation of best fit for an exponential function is y=4 (5x), predict what the function will be at x=2
y=100
400
Determine if this data belongs to a function that is linear, quadratic or exponential.

Exponential because the ratios are the same.
500
Determine if this graph has a positive, negative, or zero rate of change?
Positive
500
Is the first differences, second differences and the ratios are not the same, what type of function do we have?
We cannot determine.
500
Does this data set match this table of values?
___x_____|____y____
1 | 1
2 | 2
3 | 4
4 | 8
5 | 16
No
500
Determine if this data belongs to a function that is linear, quadratic or exponential.
___x______y____
0 3000
1 2950
2 2900
3 2850
4 2800
Cannot determine based on the given data.