Vocabulary
Data
Interpreting Graphs
Making Graphs
Fun Facts
100
What is the definition of initial position?
The starting place of an object, before it moves.
100
How do you find the average of a data set?
Add the values together, then divide by the number of values.
100
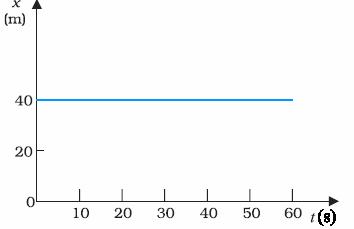
The object is stationary at 40m for 60 seconds.
100
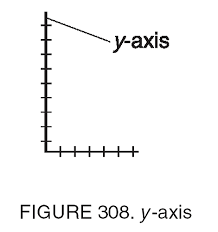
Draw an x & y axis. Label the y-axis.
100
What is Ms. Rapciak's favorite sport to play?
Volleyball!
200
What is the definition for speed?
The change in an object's position over time.
*if you did not mention position and time, give yourself 100 points*
200
How many trials should you conduct if you want to have reliable data?
At least three trials. The more trials you conduct, the closer your average value is to the "true" value.
200
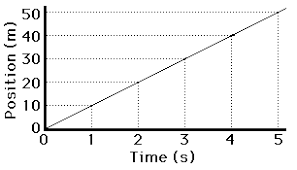
Starting at 0m, the object travels at a velocity of 10 m/s for 5 seconds.
200
Make a position-time graph that displays an object moving at a constant, positive velocity.
*The initial position could have been anywhere on the y-axis*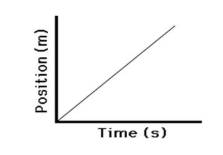
200
How many times per year does the Empire State Building get struck by lightning?
23 times per year
(you can get points for answering 20 - 25)
300
What is the difference between speed and velocity?
Velocity involves the direction an object travels in.
Velocity can be negative, speed cannot.
300
A group of students measured two quantities: time and position. What are the ranges of the data? (two answers)
Time (s) Position (cm)
0 0
5 25
10 50
15 75
Range of time values: 0 - 15s
Range of position values: 0 - 75cm
300
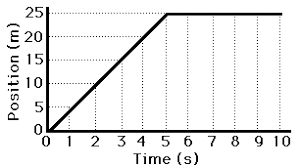
Starting at 0m, the object travels at a constant velocity of 5 m/s for 5 seconds, then stays stationary for 5 more seconds. Its final position is 25m.
300
What are the steps of making a position-time graph by hand?
(hint: we wrote these down in our notebooks during class)
1. Draw your x & y axes (leave space for labels!)
2. Label your axes (don't forget units!)
3. Determine the ranges of your data, then determine the scales of your axes (this is the hard part)
4. Plot your data points
5. Draw a line to connect the points
300
What year did the National Weather Service start naming hurricanes and tropical storms?
1953
(points for 1950 - 1955)
400
What is the definition of reliable data?
Data that is collected with at least three trials, and has consistent data points (small range).
400
Evaluate the reliability of this speed tube data. What would be your recommendation for this group?
Time (s) Position (cm)
Trial 1 Trial 2 Trial 3
2 10 15 11
4 18 25 19
6 27 32 27
8 35 38 35.5
Trials 1 & 3 are consistent with one another.
Trial 2 is inconsistent with the other trials.
I would repeat the experiment one more time and see how Trial 4 compares with the other data.
400
Which object traveled the farthest?
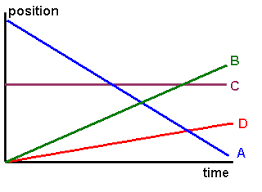
Object A.
400
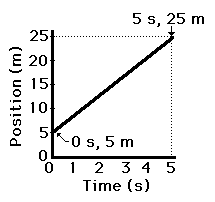
Draw a p-t graph:
The object has an initial position of 5m. It travels at a constant velocity of 4 m/s for five seconds.
400
What is the fastest speed for information to travel between neurons in the human brain?
250 mph!
500
What is a practical test?
A supervised test that involves the application of skills. In other words, a test that is "hands-on".
500
After we gather data in science, we can analyze the data in order to form ____________ and we can evaluate the data's ______________.
*note: this information will not be on the assessments for this unit. just an interesting prompt to think about.*
After we gather data in science, we can analyze the data in order to form conclusions and we can evaluate the data's reliability.
500
Calculate the velocity of each object. (The pink line has an initial position of 30cm.)

Green: -10 cm/s
Pink: 3 cm/s
Red: 0 cm/s
500
Draw a p-t graph:
Object 1 & Object 2 have the same initial position (5m). They both move at a constant, negative velocity for 5 seconds.
Object 1's speed is half as large as Object 2's speed.
(see the whiteboard)
500
What is the only letter in the English alphabet that does not appear in the Periodic Table of the Elements?
J