Box Plots
Vocabulary
Measures of Center
Dot Plots / Histograms (Double Points)
Spiral Review
100
What is the median? 1, 3, 7, 9, 11, 13, 15
9
100
What is the definition of mode?
The number in a data set that appears the most.
100
Median: 83 , 97 , 85 , 84 , 96 , 80 , 80 , 87 , 91
85
100
Make a dot plot for the following data set.
2, 3, 2, 5 , 10, 9, 7, 7, 9, 15, 8
100
Solve: 2x - 2 = 50
x = 26
200
What is the lower quartile? 1, 3, 7, 9, 11, 13, 15
3
200
What is the definition of median?
The number in the middle when the numbers are in order from least to greatest.
200
Mean: 83 , 97 , 85 , 84 , 96 , 80 , 80 , 87 , 91
87
200
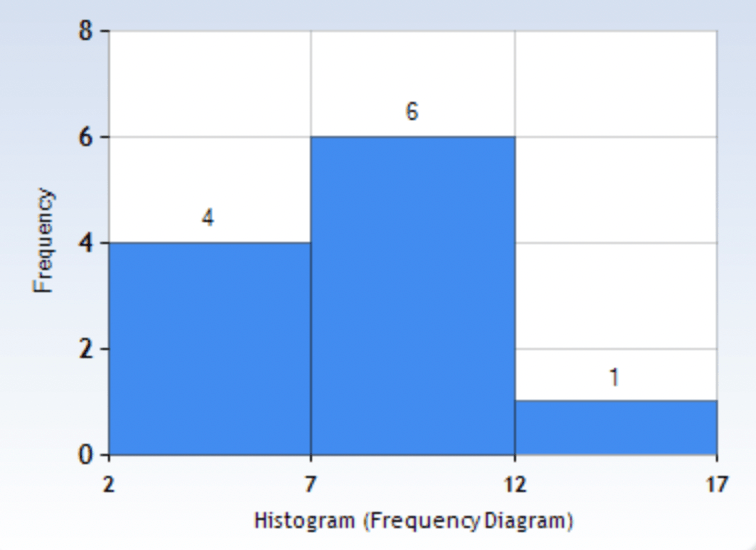
Make a histogram and frequency table for the following set of data.
2, 3, 2, 5 , 10, 9, 7, 7, 9, 15, 8
(Create 4 intervals 2-7, 7-12, 12-17)
200
Combine like terms: (you can solve for x because there is no equal sign)
4x + 3 + 5 -2x - 2
2x - 6
300
What is the Upper Quartile? 1, 3, 7, 9, 11, 13, 15
13
300
How do you find the mean?
Add all of the numbers in the data set together. Divide by the amount of numbers in the data set.
300
Mode: 83 , 97 , 85 , 84 , 96 , 80 , 80 , 87 , 91
80
300
What 3 measures of center can you find with a dot plot?
Mean, Median, Mode
300
What is absolute value of -15
15
400
What is the IQR (Interquartile Range)? 1, 3, 7, 9, 11, 13, 15
10
400
What is interquartile range?
The difference between quartile 3 and quartile 1 (the range of the box in the box plot).
400
Median: 79 , 70 , 71 , 60 , 60
70
400
How can you use a histogram?
Answers will vary.
400
I have 7 CD's with 91 songs on them all together, How many songs do I have per CD?
13 songs per CD.
500
Create a box blot. 1, 3, 7, 9, 11, 13, 15
Check box plot
500
How do you find the lower quartile?
By finding the median of the left side of the data.
500
Mean: 30 , 36 , 47 , 50 , 50 , 50
43.8
500
How can you identify outliers in a dot plot?
The outlier stands out either on the far left or right in the dot plot.
500
What is 20% of 50?
10