Scientific Method
Science Safety
Graphing
Measurement
Hodge Podge
100
Question > Observation/research > Hypothesis > Experiment > Analysis > Conclusion
What are the steps of the scientific method
100
True or false - it's okay to chew gum during science lab
What is false
100
Which axis is the vertical axis? (goes up and down)
The Y axis
100
1 cm = how many millimeters?
What is 10 millimeters
100
Use your senses to notice a fact
What is an observation
200
a prediction based on observation and research
What is a hypothesis
200
If you do not understand a direction or part of a lab procedure, you should
What is ask the teacher before proceeding
200
On which axis do you put the Independent Variable?
On the X axis
200
In the metric system the base unit for measuring liquids is
What is a Liter
200
Inference
What is something you think based on an observation
300
This is the process scientists use to answer questions
What is the scientific method
300
Open-toed shoes
What shouldn't you wear on lab days
300
What kind of graph would you us make to show how a variable changes over time?
A line graph
300
If you were going to measure the length of the science room it would be best to measure it in which unit?
What is meters
300
This is the variable that you manipulate during an experiment
Independent Variable
400
The variable that you observe and measure during an experiment
What is the dependent variable
400
What is the first thing you should do if you break something during science lab, or any time during class
What is tell the teacher
400
Why do scientists use graphs?
To organize, analyze and communicate findings and data
400
How do you calculate an average?
What is add up the trials and divide by how many trials you did.
400
You counted 10 cookies in the package. This is an example of
What is Quantitative Observation
500
What is a constant variable. It's also sometimes called a controlled variable
What is a variable that does not change during an experiment because you make sure it stays the same
500
You must tie this back during lab experiments
What is long hair
500
What could you conclude from this graph?
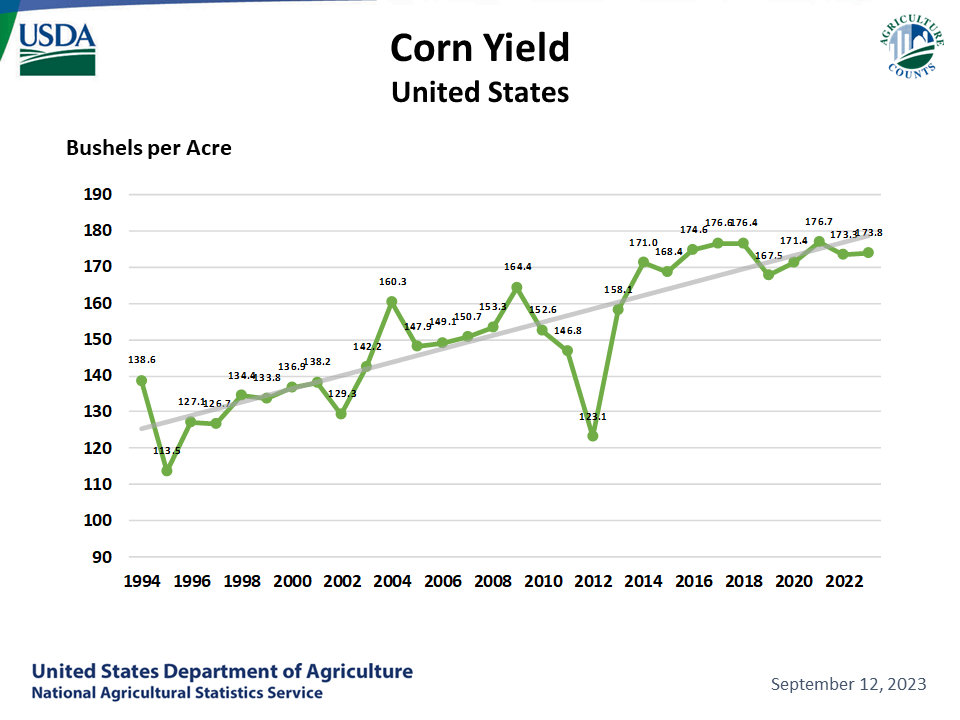
Corn yield in the US has increase over time.
500
a drumstick is 0.37 meters long. How many millimeters is that?
What is 370 mm
500
True or false: “This popcorn is REALLY salty”, is an example of a quantitative observation
What is false