Slopes and Intercepts
Tables and Graphs
Functions
Functions in the Real World
Misc.
100
This is the y-intercept of this graph.

(0,1)
100
This is the absolute minimum of the function below.
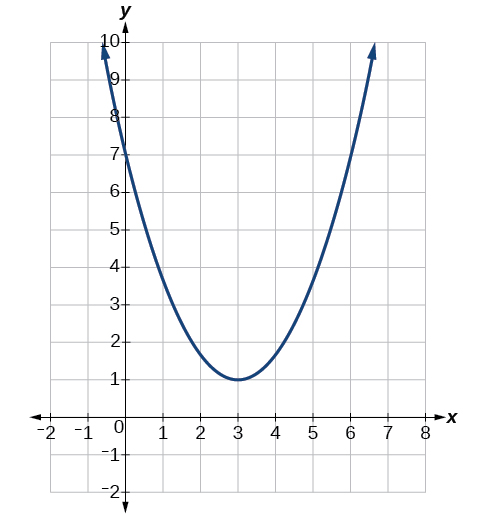
1
100

Function, or NOT a function?
Function
100
Jimmy works at Bestbuy and gets paid an hourly rate, and also gets paid a bonus.
If the equation y = 20x + 15 represents the amount of money he can earn for a week, then what does the variable y stand for ?
If the equation y = 20x + 15 represents the amount of money he can earn for a week, then what does the variable y stand for ?
Amount of money $$$
100
The slope of this line and the meaning in the real world is this.

m = 0
They read 1 book over all the weeks recorded.
200
The Power Tower ride begins at 200 ft and passengers drop in 7 seconds. The table represents f(x), a function that can be used to predict the height after various points in time.
On a graph of f(x), this is what the y-intercept represents.

The height at the beginning of the ride (before the drop).
200
Draw a graph for this equation.
y= -2x + 3
You may graph it any way you know how.
y= -2x + 3
You may graph it any way you know how.
200
What is the name of the method used to determine whether a graph is a function or not?
Vertical Line Test
200
Jimmy works at Best Buy and gets paid an hourly rate, and also gets paid a bonus.
If the equation y = 20x + 15 represents the amount of money he can earn for a week, then how much does he get paid per hour?
$20
200
The graph shows the amount of air, y, over the time, x, while Drew is scuba diving. This is the domain and the range of the function shown in the graph.

Domain: 0 ≤ x ≤ 6
Range: 0 ≤ y ≤ 40
300
The function shown on the graph represents the time it takes to go down an elevator.
This is what the x-intercept represents in the situation.

The time it takes to reach the ground floor.
300
Look at this table:
x_|_y
0 | 8
1 | 6
2 | 4
Is the slope negative, positive, zero, or undefined? How do you know?
Negative
300
Function or NOT a function?
Function
300
Your Gym membership charges 20 dollars a month, plus a fee of 10 dollar fee each time you take a kickboxing class.
Write an equation for to show how your total price (y) is a function of how many classes you take (x).
Write an equation for to show how your total price (y) is a function of how many classes you take (x).
total price = 10 x (num. of classes) + 20
y = 10x + 20
300
Your weight is a function of how many bags of cheetos you eat.
What is the reasonable domain?
x ≥ 0
400
On a coordinate plane, you have a line with points at (1,1) and at (1,4).
This is the slope of this line.
Undefined, there is no slope.
400
Draw a graph that shows how money is a function of time(hours)
for somebody babysitting, if they get paid a flat $50 for the
evening.
for somebody babysitting, if they get paid a flat $50 for the
evening.
horizontalline

400
What is f(-1) when f(x) = 3x2 - 6x + 15
f(-1) = 24
400
A candle is burning. The height of the candle is a function of the time the candle spends burning.
The slope of this function is: positive, negative, zero, or undefined.
NEGATIVE
400
This is the reasonable domain and range of the situation below.
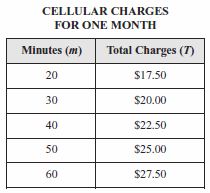
m ≥ 0
T ≥ 12.50
500
This is the cost per ticket. Round to the nearest hundredth.
$53.33
500
A scientist is experimenting with bacteria. She starts with 500 bacteria in a petri dish. She introduces a toxic substance that causes the sample size to reduce by ½ every hour.
Create a table and graph to represent this situation.

500

Make a table that shows an example of something that is NOT A FUNCTION.
500
There are two cell phone plans for texting. Each one's plan can be modeled with an equation where x represents the number of texts over your limit, and y is the total price.
Plan A: y = 0.25x + 17 Plan B: y = 0.15x + 25
Plan B is cheaper BY HOW MUCH if you go 100 texts over your limit?
Plan A: y = 0.25x + 17 Plan B: y = 0.15x + 25
Plan B is cheaper BY HOW MUCH if you go 100 texts over your limit?
$2.00
500
The equation to represent the g(x),the green function, in relation to f(x) = x2, the blue function, is this.
![]()
g(x) = (x-2)2 - 3