Scientific Method
Making Graphs
Variables
Interpreting Graphs
Math and Measurement
100
A prediction or educated guess
hypothesis
100
The horizontal axis of a graph where the independent variable is graphed is the ____ axis
X
100
In an experiment to see which of 5 mice can complete a maze the fastest, the independent variable is:
Mice
100
Data likely to be shown in a line graph
Numerical data, such as time (or other example)
100
If 1m=100cm, 12cm=__m
0.12m
200
You observe that your dog likes to play with a certain toy. You predict that the dog likes chew toys best. You have made:
a hypothesis
200
The Y axis is where the _____________ variable is graphed
Dependent
200
A scientist sprays one plant with pesticide and the other with water. They count how many insects are on both plants. The dependent variable is:
How many insects
200
Data likely to be shown as a bar graph
categories such as colors (or other example)
200
Round 7,489 to the nearest hundred
7,500
300
To learn the favorite food of wild birds, a scientist sets up feeders with three different types of seeds. This is
an experiment
300
This graph is missing:
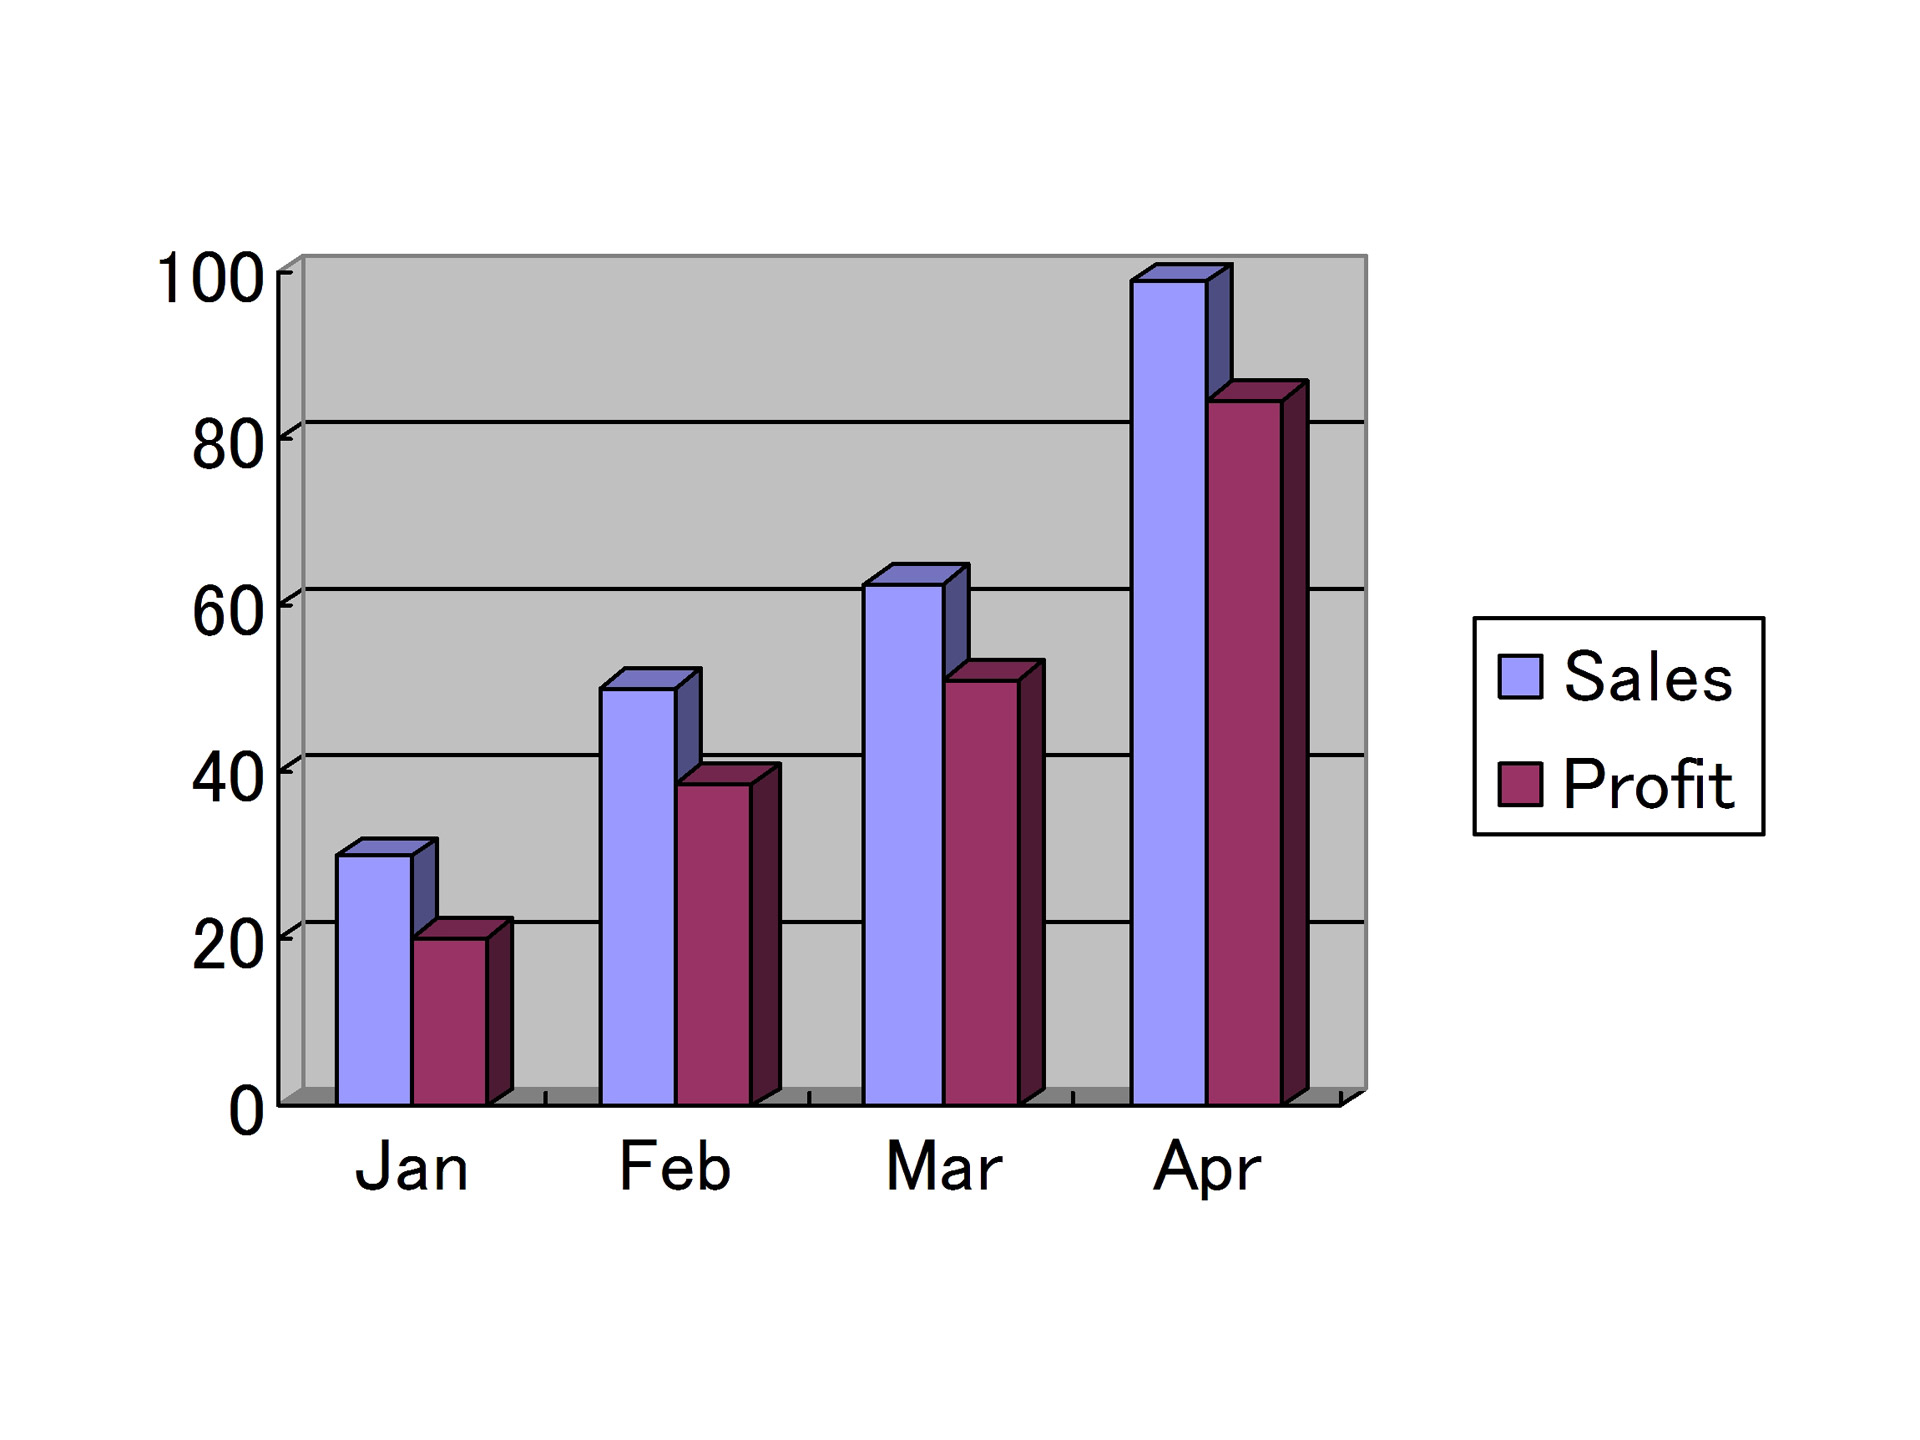
-Title
-Labels
300
In an experiment to see how much bedtime effects grades, students are told to all eat the same breakfast and get the same amount of exercise. These are examples of
control variables
300
In the graph you are about to see, the product that sells more:
Product A
300
if 1L=1000mL, 3.4L=__mL
3,400mL
400
You see tracks in fresh snow and investigate their shape. This is
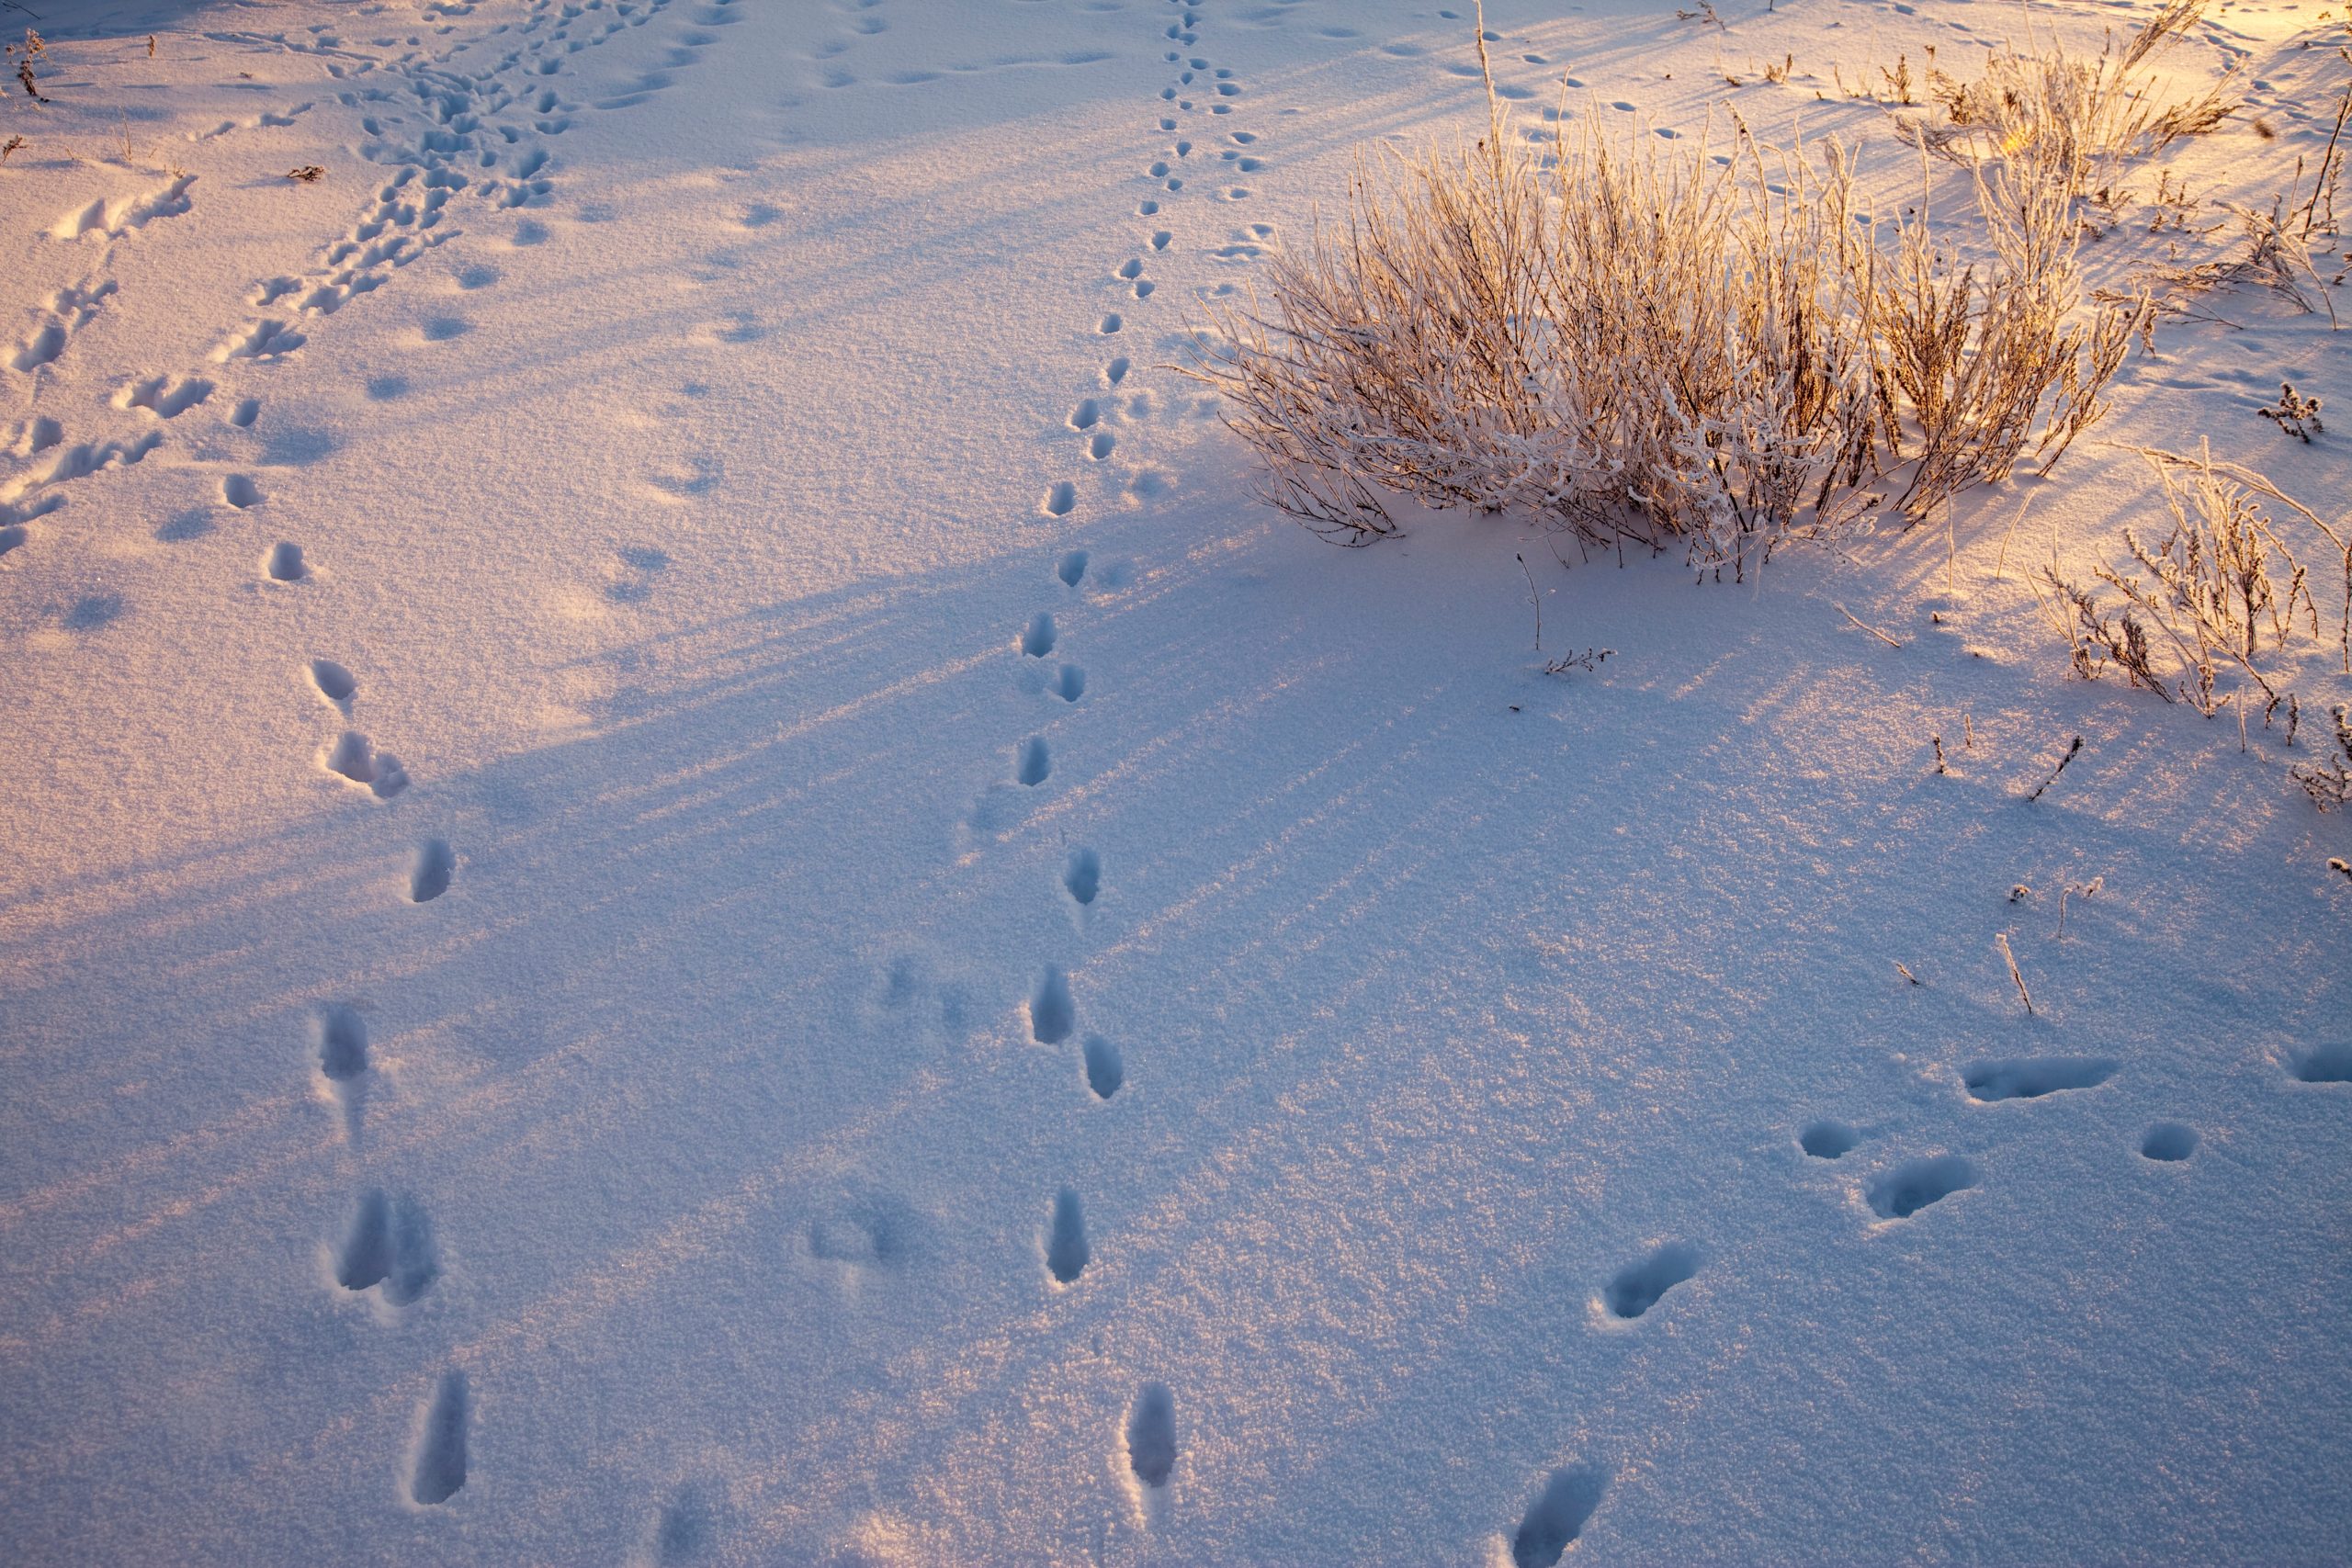
an observation
400
All the parts a graph needs to be complete
Title, scale, labels on both axes, sometimes a key
400
A student designs an experiment to see if potatoes need fertilizer to grow. They put three of their plants on the windowsill and run out of space, so they put two more in the closet. Their mistake was:
Two variables/no control
400
In the graph you are about to see, the period with the fewest students is:
Period 4
400
The average of 3, 7, and 5 is:
5
500
A scientist observes lightening striking trees up on a hill. They predict that height is the main risk to lightening strikes. They monitor trees growing at different heights and write down how many strikes they have observed. What is their observation, hypothesis, and experiment?
observation: lightening strikes
hypothesis: lightening strikes based on height
experiment: monitoring trees at different elevations
500
Your experiment is designed to find out how time of day effects temperature in your house. What goes on the x-axis of your graph and what goes on the y-axis?
x: time
y: temperature
500
Experiment: Surveying students about how many hours of video games they play and what grades they get. Give the
independent variable
dependent variable
a control variable
independent: hours
dependent: grades
control: many possible answers
500
In the graph you are about to see, are you concerns about any of the frog species you see? Why or why not?
(multiple possible answers)
500
if 1km=1000m and 1m=100cm, 2.35km=___cm
235,000