Name that Distribution
Measures of Center
Measures of Variability
Histograms
Boxplots
100
Describe the Distribution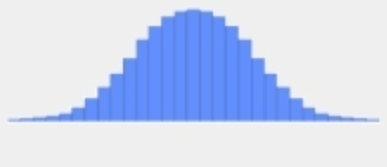
Bell-Shaped and Symmetric
100
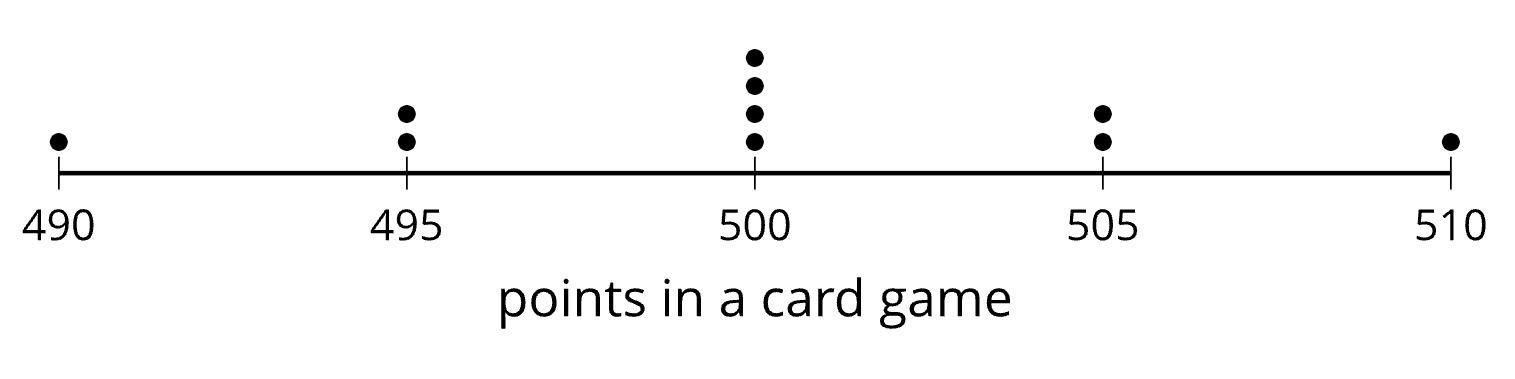
What represents the most reoccuring data value in a data set?
Mode
100
Which Dot Plot has a higher standard deviation? top or bottom?
The Top because the data is more spread out from the mean.
100
Which interval or group has only 2 states?

1.75-2.00 percent
100
What is the median?
10 branches
200
Describe the Distribution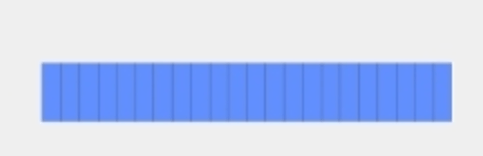
Uniform and Symmetric
200
Which Measure of Center represents the half way point between the data?
The Median.
200
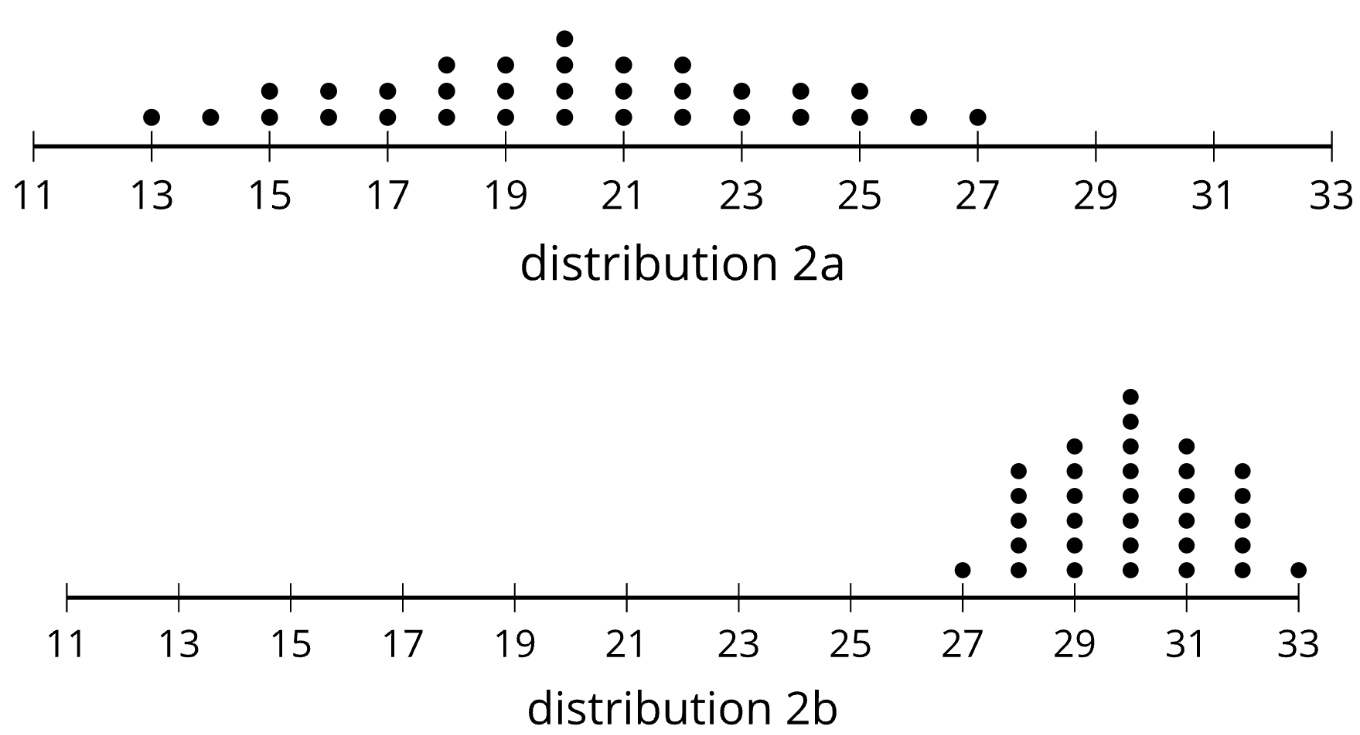
Which dot plot has more variability in its data? Top or Bottom?
Top has more variability because the data is more spread out.
200
What is the total number of states represented here?
13 states
200
What is Quartile 1? (Q1)
7
300
Describe the Distribution.
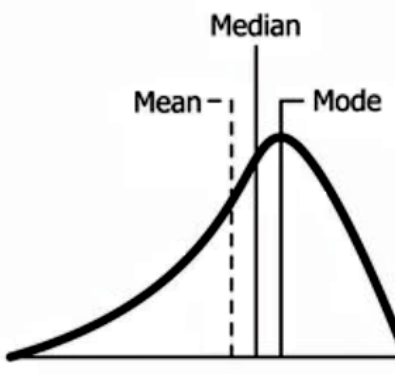
Skewed-Left
300
Which will be greater, the mean or the median?
Neither, they are equal because it is symmetric.
300
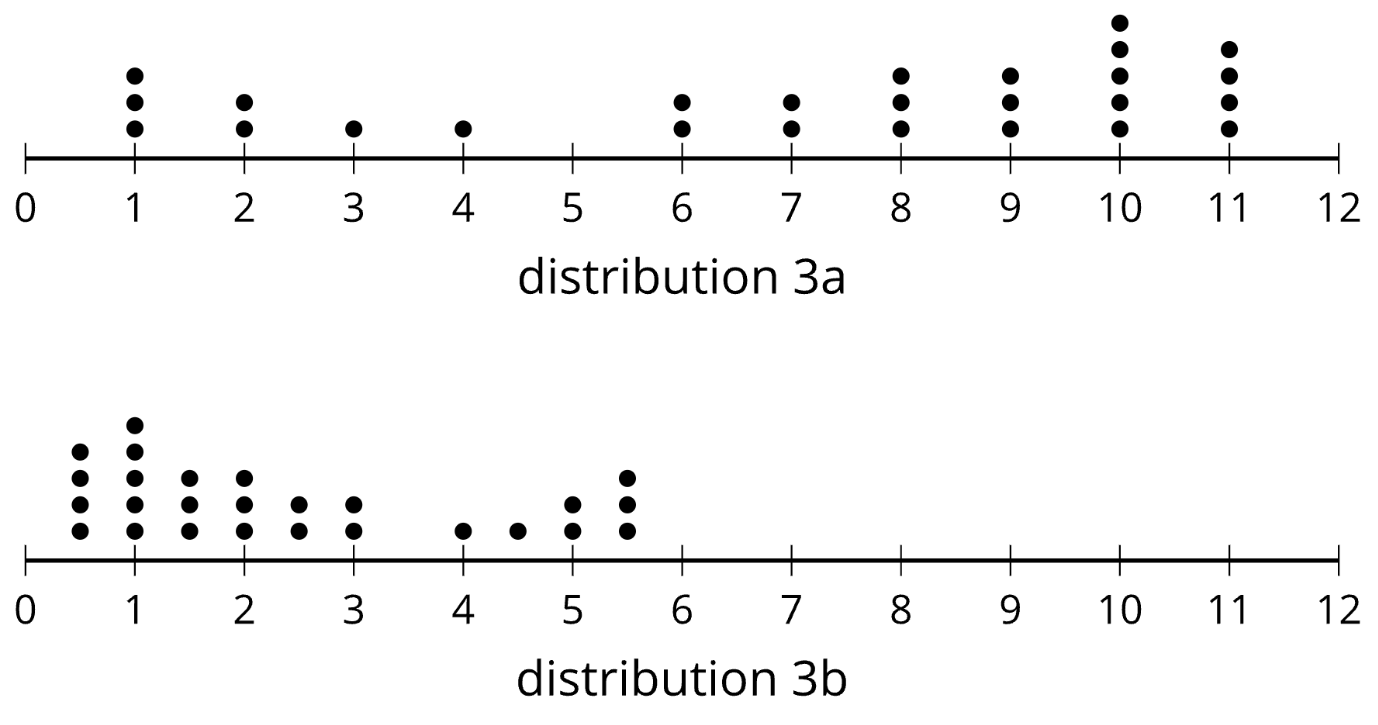
Which dot plot has a higher standard deviation? 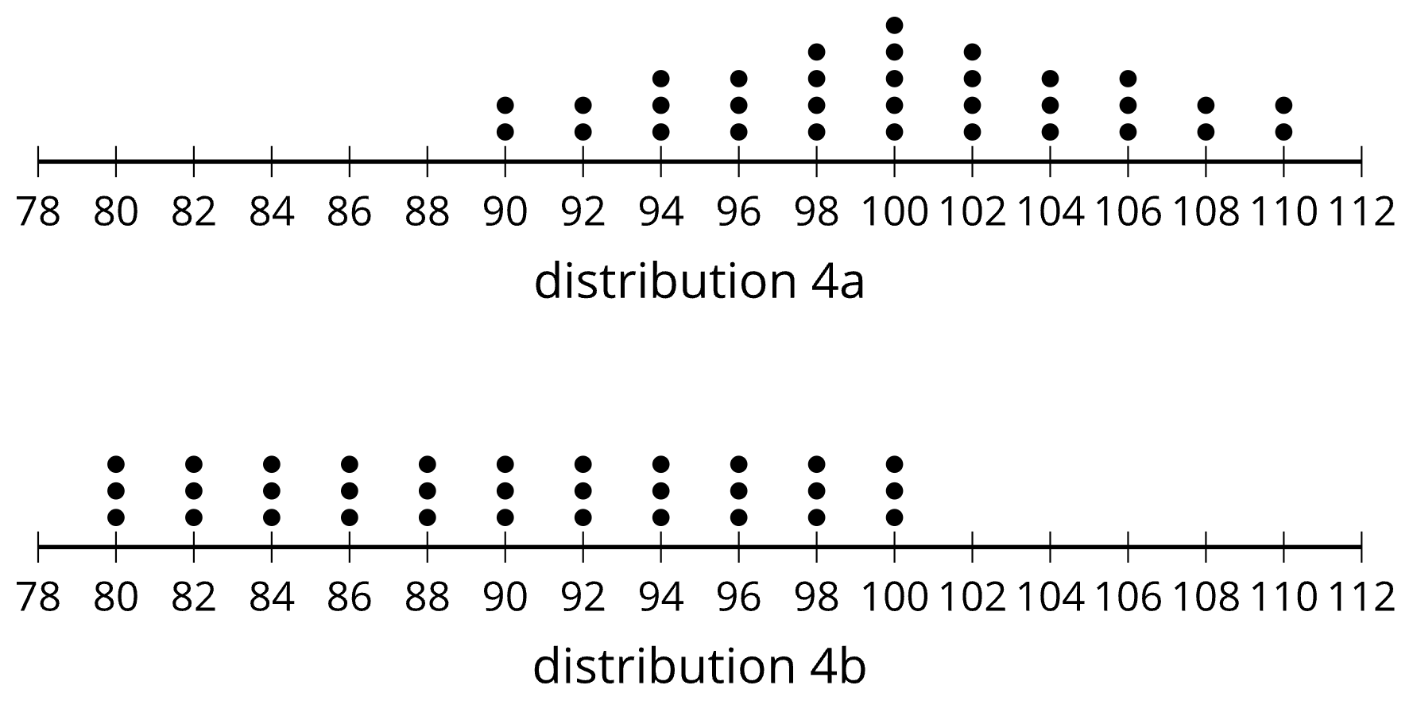
Bottom, Because the more data values are further from the mean than the one on top.
300
What is the mode of this data set?

There's not one. Three intervals are tied for the most. 2-2.25, 2.25-2.5, and 2.75-3.
300
What is the 5 number summary for this box plot?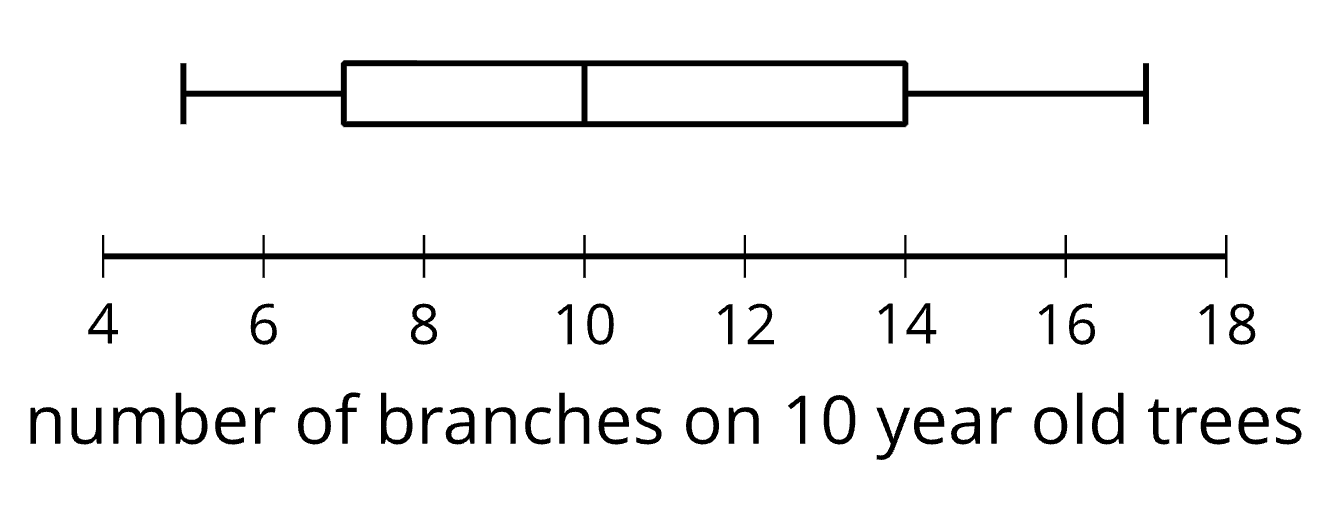
min = 5, Q1 = 7, Median = 10, Q3 = 14, Last = 17
400
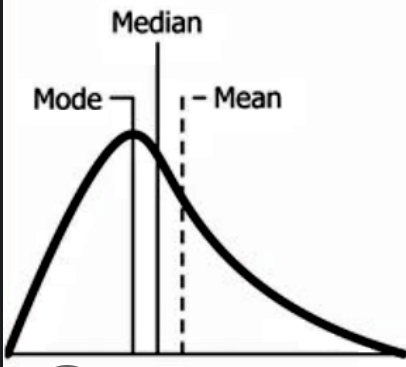
Skewed-Right
400
Which is greater: the mean or the median?
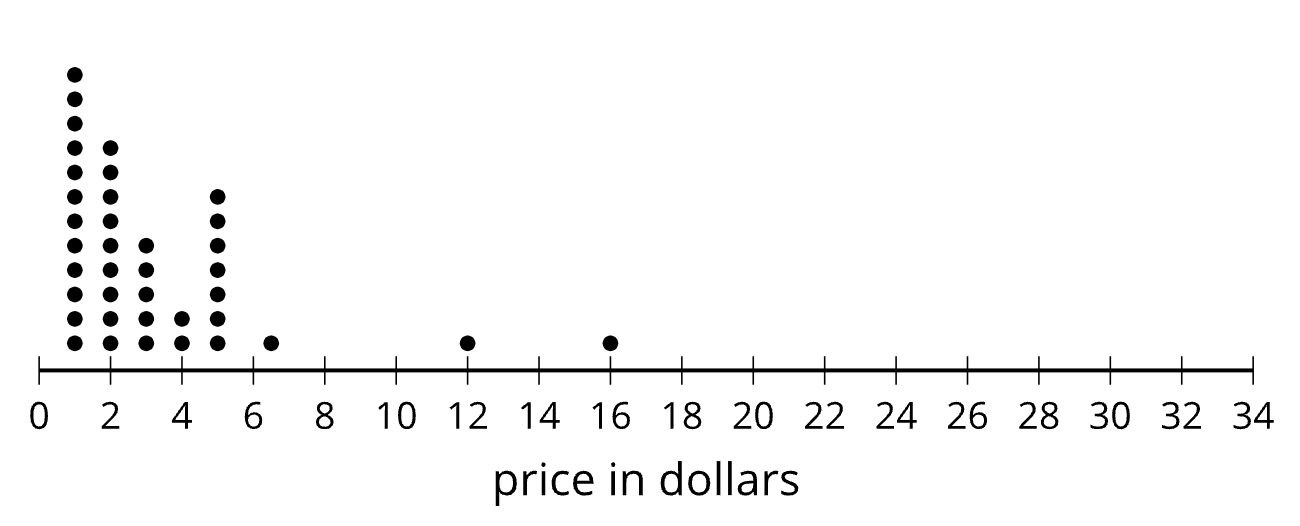
The mean will be greater, because the large outliers of 12 and 16 will skew our mean to the right causing it to increase.
400
Which Dot Plot has a higher standard deviation?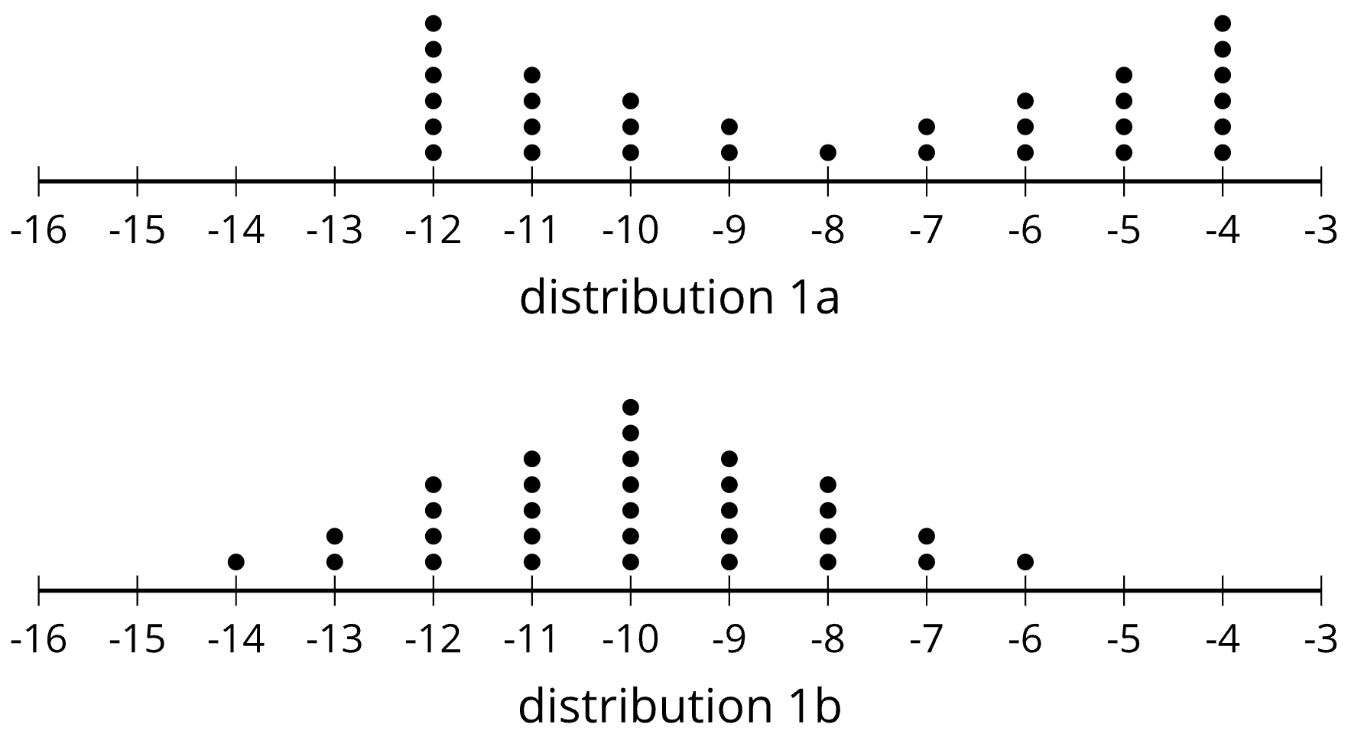
The Top has a high standard deviation, because more data values are far away from the mean than the bottom.
400
What is the mean of this data?
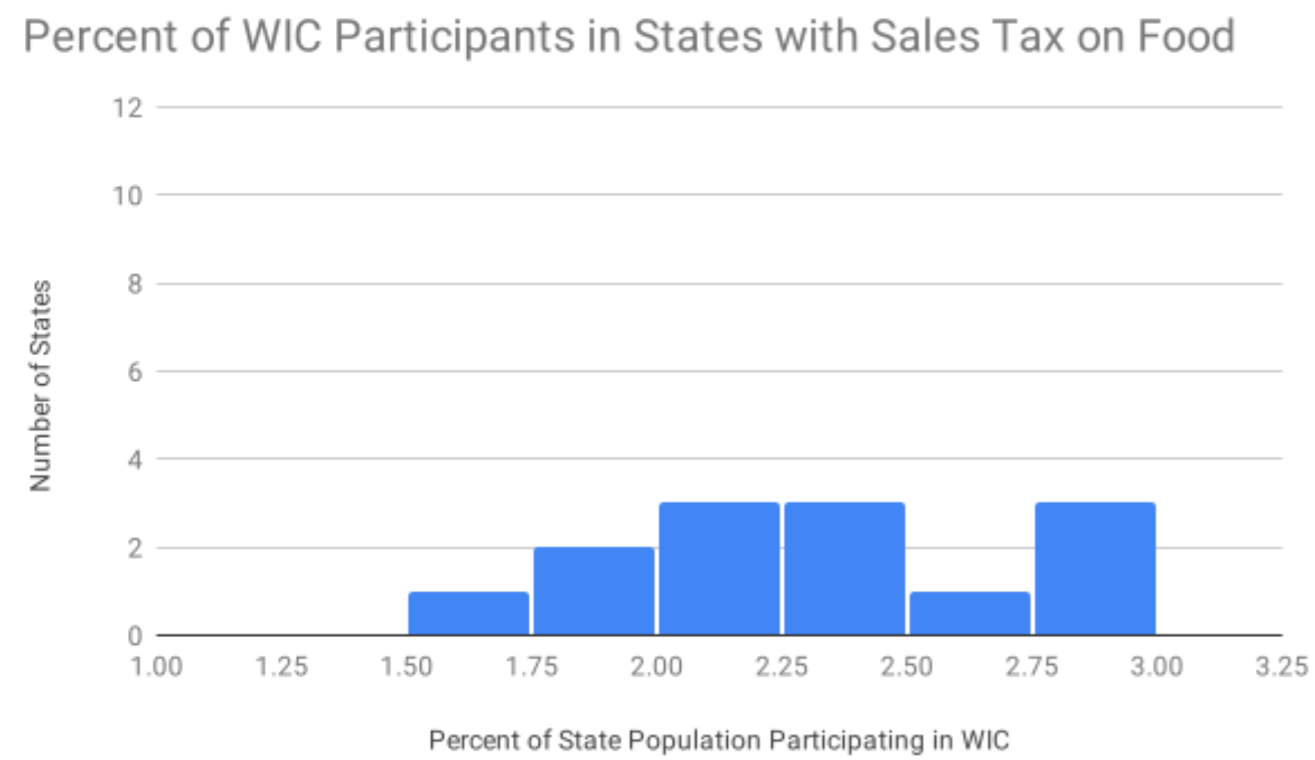
It is not possible to calculate the mean from a histogram, because we do not have the detailed values for each data point.
400
How many trees were studied?

Not enough information. You can not see all the individual data points on a boxplot.
500
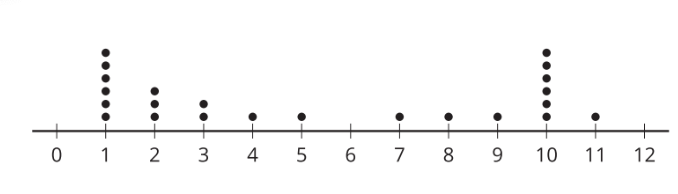
Bimodal
500
If there are outliers in the data, is the mean (Average) or the median (middle) more representative of the data?
Median, because it is resistant to outliers.
500
Which measure of variability can we NOT get from a Box Plot? Standard Deviation, or IQR?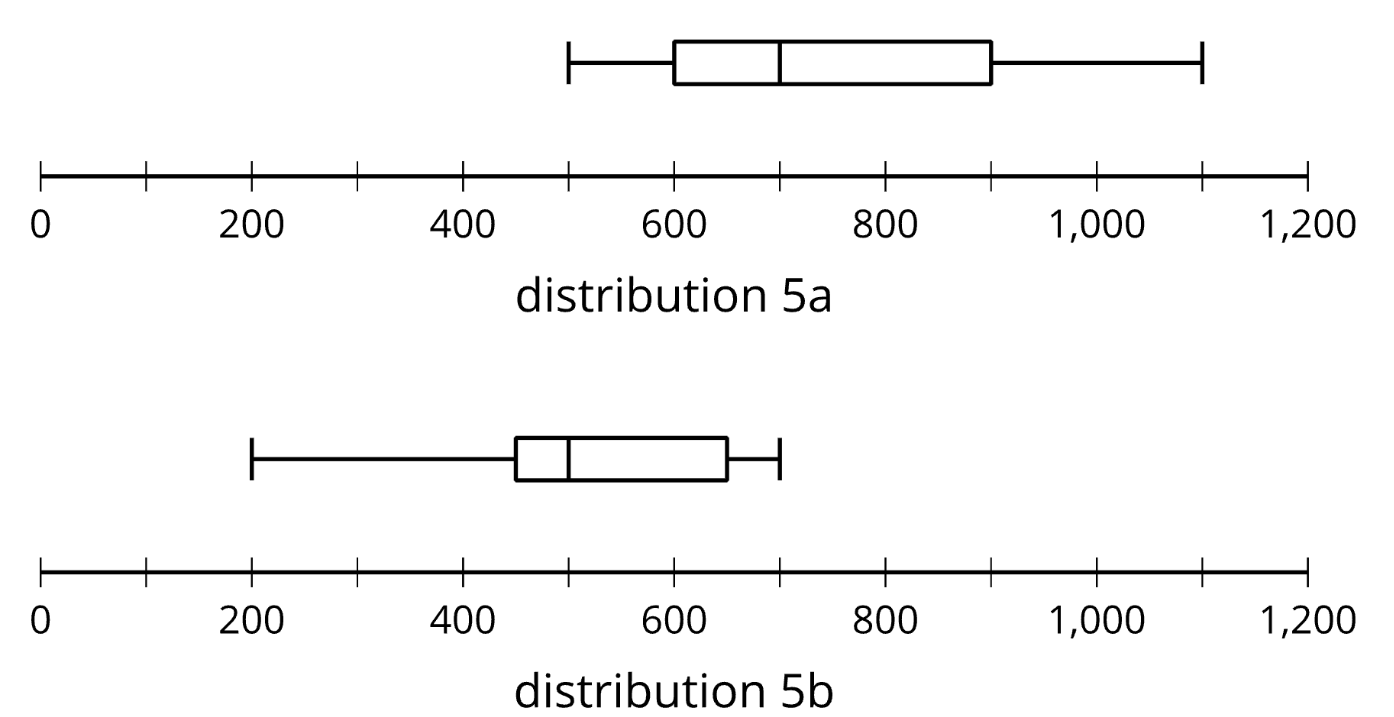
We can not get the standard deviation from a box plot, because we cannot calculate the mean because we can not see the individual data points.
500
What is the range for this data set?
1.5
500
What is the IQR of the boxplot?

IQR = 14 - 7 = 7.