Mean, Median, Mode, Range
Describing Distributions
Box Plots
IQR / IQR Rule
Miscellaneous
100
Find the mode of:
6, 4, 5, 7, 3, 7, 5, 4, 4, 5, 6, 5
5
100
What is the Modality of this distribution? Only get full points by using the appropriate statistics vocabulary.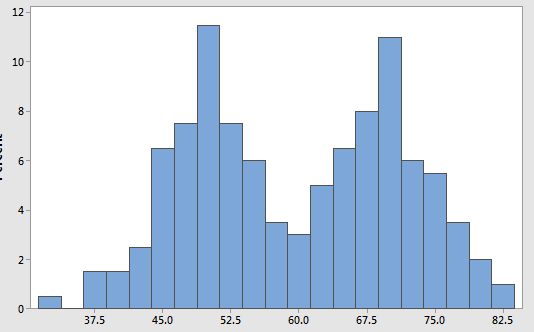
Bimodal
100
In order to make a box plot, we must find the Median, First Quartile, Third Quartile, Minimum, and Maximum values in our data set. These five values create what is known as the _____ _________ ___________
"Five Number Summary"
100
Find the IQR for the five-number summary below:
Q1: 7, median: 9, Q3: 12, Min: 2, Max: 14
5
100
What does IQR stand for? And how to do you find it?
"interquartile range"; Q3 - Q1
200
Find the range of:
45, 65, 12, 87, 65, 98, 62, 55, 27
98 - 12 = 86
200
Describe the Symmetry of the distribution. Only get full points if you use the appropriate Statistics vocabulary.
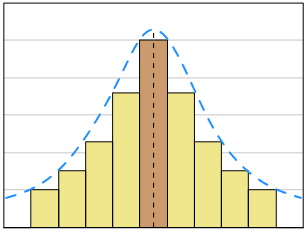
Symmetric
200
True or False: "If the right whisker is longer than the left whisker, then the distribution is called left skewed."
False
200
A data set has a third quartile of 62 and first quartile of 27. What are the upper and lower boundary values that separate outliers from the rest of the data set?
Lowerbound = -25.5
Upperbound = 114.5
200
What is the five-number summary for a box plot?
min, max, median, Q1, and Q3
300
What is the mean (average) of:
5, 8, 9, 6, 4, 5, 2, 1
total = 40 / 8 = 5
300
Describe the Modality of the distribution. Only gets full points if the appropriate Statistics vocabulary is used.

Unimodal
300
What is the formula/procedure for calculating the upper and lower bounds?
Q3 + (1.5 * IQR) Q1 - (1.5 * IQR)
300
Find the upperbound and lowerbound for the given set of data: 9, 11, 13, 15, 2, 13, 17, 15
Lowerbound = 2.5 Upperbound = 22.5
300
True or False: "Boxplots display the median of a distribution inside the rectangle located between the whiskers."
True
400
What is the median of:
5, 8, 9, 6, 5, 2, 4, 1
1, 2, 4, (5, 5), 6, 8, 9 so median = 5
400
Describe the Modality and Symmetry of the distribution. Can only get full points if the appropriate Statistics vocabulary is used.
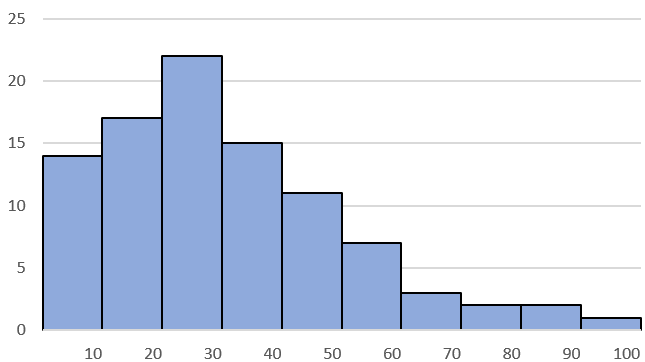
Unimodal, Right Skewed.
400
How can we tell if the distribution of a Boxplot is Symmetrical?
The left and right whiskers are about equal in size, and the median line is in the center of the rectangle of the boxplot.
400
Find the upper bound and lower bound for the data set below.
20, 20, 19, 26, 31, 11, 27, 22, 23, 20
Lowerbound = 11
Upperbound = 35
400
What does it mean if data is "skewed"?
Data is "skewed" when it is not evenly distributed. The mean is influenced, or pulled in a certain direction. We also say it has a "tail" on one side of the graph.
500
Find the mean, median, mode and range of:
6, 7, 14, 4, 7, 8, 7, 3
mean = 7
median = 7
mode = 7
range = 14 - 3 = 11
500
Describe the Shape and Symmetry of the distribution. Can only get full points if the appropriate Statistics vocabulary is used.
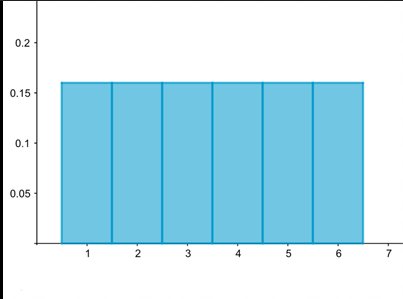
Uniform, Symmetric
500
Why can't we use a box plot to determine the Modality (the number of peaks) in a distribution?
A boxplot does not have a "vertical" element that can identify the number of peaks in a distribution.
500
In a data set, the third quartile is 36 and the first quartile is 12. Would a value of 70 be considered an outlier?
No.
500
How does a left skewed distribution affect the mean of the data set?
It pulls the mean to the left. As a result, the mean is less than the median for left-skewed data.