Measures of Center
Measures of Variance
Graphs of Data
Comparing Data
100
Which measure of center gives us an average data point?
a) mean
b) median
c) mode
d) range
a) mean
100
What is the range of the data set below?
a) 10
b) 7
c) 3
d) 5
b) 7
100
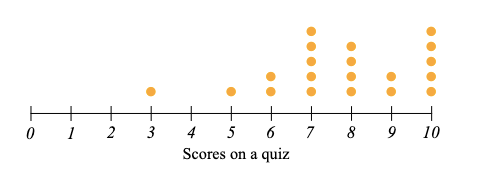
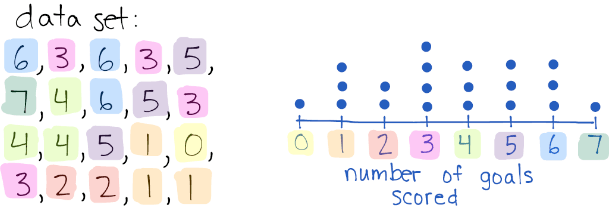
Describe the distribution of the data set below.
a) symmetrical
b) skewed right
c) skewed left
d) uniform
b) skewed right
100
Describe the distribution of the data set
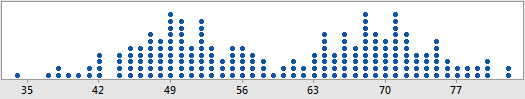 a) Symmetrical
b) Bi-modal
c) Uniform
d) Bell-shaped
a) Symmetrical
AND
b) Bi-modal
200
Which measure of center is NOT affected by outliers?
a) mean
b) median
c) range
d) variability
b) median
200
What is the range of the data set below?
 a) 30
a) 30
b) 11
c) 26
d) 5
c) 26
200
What inferences can we make about the quiz scores using the data below? Select all that apply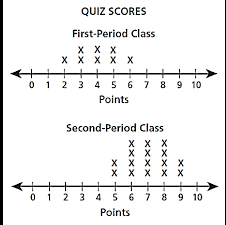
a) They are both the same amount of consistency because they have the same range
b) Second period has better scores on average because they have a higher median
c) First period did worse than second period because they had a lower minimum value
d) All students in second period did better than all students in first period
e) some students in first period did better than some students in second period
A, B, E
200
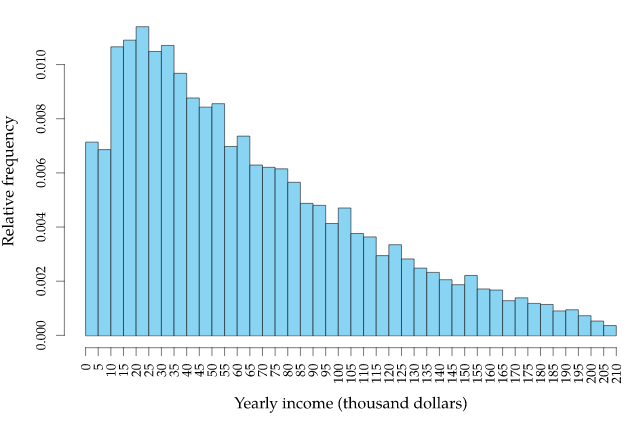
What is the distribution of the data set, and what measure of center would be best to use?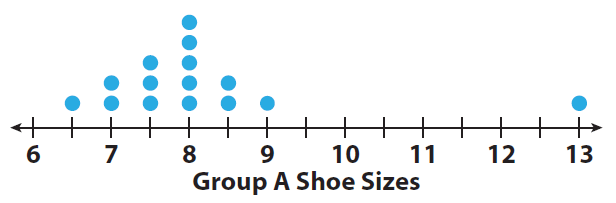 a) Symmetrical distribution, use mean
b) Skewed right, use mean
c) Skewed right, use median
d) Bell-shaped, use mean
c) Skewed right, use median
300
Which measure of center is greatly affected by outliers?
a) mean
b) median
c) range
d) variability
a) mean
300
What is the IQR of the data set below?
 a) 26
a) 26
b) 10
c) 18
d) 8
b) 10
300
The histogram below shows the weights of players on the national tennis team. Which interval has the most players with weights in that range? How many players are in the range?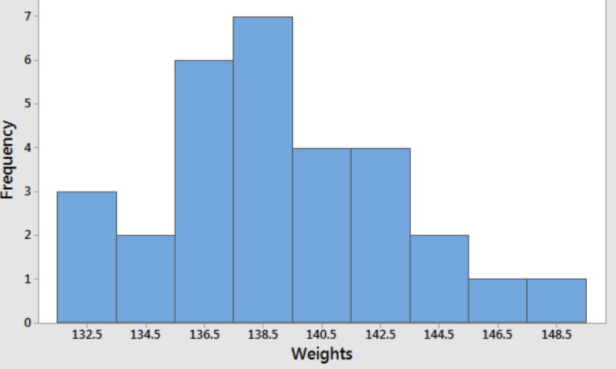 a) 138.5-140.5 (7 players)
b) 136.5-138.5 (7 players)
c) 132.5=134.5 (3 players)
d) 136.5-138.5 (6 players)
a) 138.5-140.5 (7 players)
300
Which gender is typically heavier? Why?
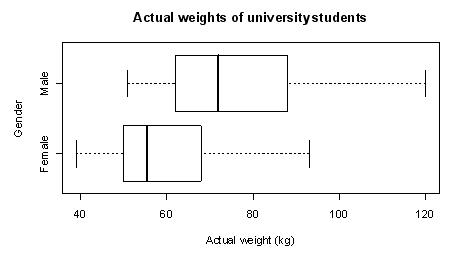
a) Females because they have a higher maximum
b) Males because they have a higher maximum
c) Males because they have a higher median
d) Males because they have a larger IQR
c) Males because they have a higher median
400
What is the mean of the following data set?
35, 54, 45, 67, 85, 21, 45, 56
a) 45
b) 408
c) 51
d) 49.5
c) 51
400
Which class has more variability in the miles they travel to school? Why?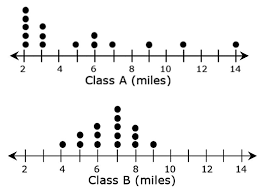
a) Class A because their data is skewed right
b) Class B because they have bell-shaped data
c) Class A because they have a larger range
d) Class B because their data is more consistent
c) Class A because they have a larger range
400
The amount of miles driven to school for two classes is shown on the dot plot below. Choose the answer choices that best describe the data. Select all that apply.
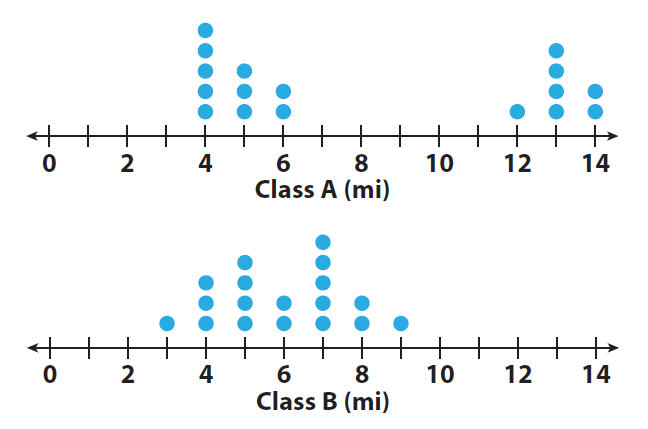
a) Class B has more consistent data because it has a lower range
b) Class A has less variability in their data because they have a lower range
c) A good measure of center to use for Class B is the mean because their data is bell shaped
d) A good measure of center to use for Class A is mean because their data is skewed
A, C
400
Who has greater variability in their heights and why?
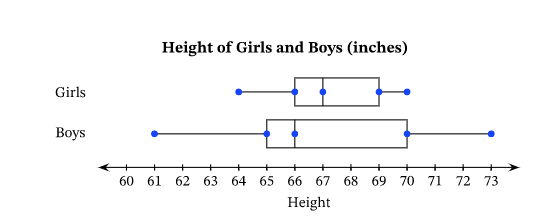 a) Girls because they have a higher median
b) Boys because they have a higher maximum
c) Boys because they have a larger IQR and range
d) Girls because they have a lower IQR and range
c) Boys because they have a larger IQR and range
500
What is the median of the data set below?
35, 54, 45, 67, 85, 21, 45, 56
a) 51
b) 45
c) 54
d) 49.5
d) 49.5
500
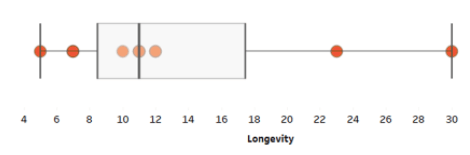
Calculate the IQR of the data set below
 a) 5
a) 5
b) 2
c) 3
d) 3.5
c) 3
500
Create a box and whisker plot using the data below regarding amount of calories in the top 10 candy bars:
210, 340, 520, 150, 155, 200, 205, 75, 310, 400
Must include: minimum, maximum, median, Q1, Q3,
500
A class was surveyed about how many hours they exercise, and how many hours they play video games. Their data is displayed on the dot plots below. Choose the answer that describes the data set. Select all that apply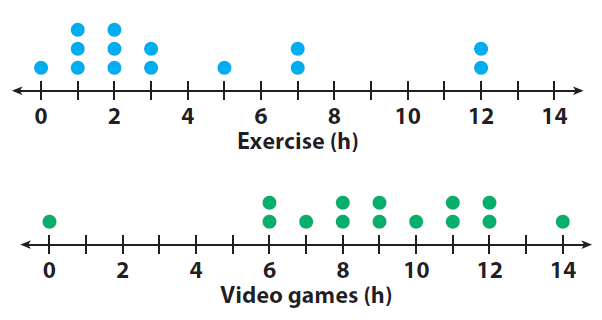 a) People in the class spend more time on average than they do exercising
b) The data for exercising is more consistent because there is a lower range
c) The data for video games is more consistent because there is a higher range
d) The data for both activities are skewed
e) The best measure of center to use for both activities is the mean
A, B, D