Pie Charts
Order of Operations / PEMDAS
Talley Charts
One Step Equations
Bar Graphs
100
What meal do students like the most?
Breakfast
100
Simplify the expression using PEMDAS.
8 x 3 + 10
34
100
What kind of information does this tally chart give us?
The students' favorite animal.
100
Solve for x. Showing your work on both sides.
3 + x = 12
x = 9
100

What is the scale of this graph?
The scale is 0-40
200
How many students like snack?
4
200
Simplify the expression using PEMDAS.
6 - 2 + (10 ÷ 5)
6
200
Which animal has the most tally marks?
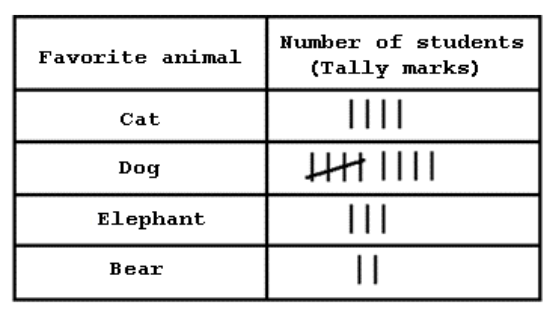
Dog
200
Solve for x. Showing your work on both sides.
x - 3 = 12
x = 15
200
What Month has the greatest number of Birthdays?
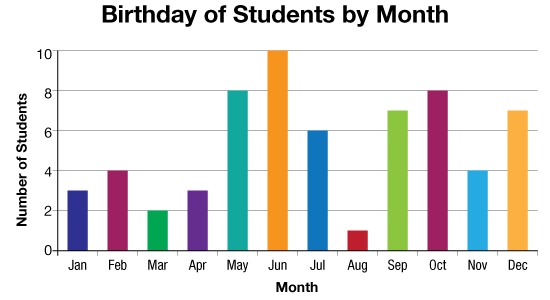
June
300
What is the least favorite meal of the students?

Snack
300
Simplify the expression using PEMDAS.
4 + 2 x 6 - 5
11
300
What is the least popular sport according to the tally chart?
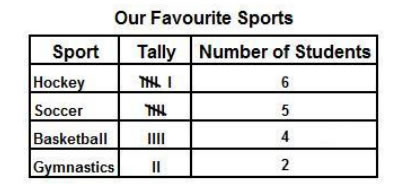
Gymnastics
300
Solve for x. Showing your work on both sides.
5x = 25
x = 5
300
Which months had 7 birthdays?
September & December
400
How many students prefer dinner?
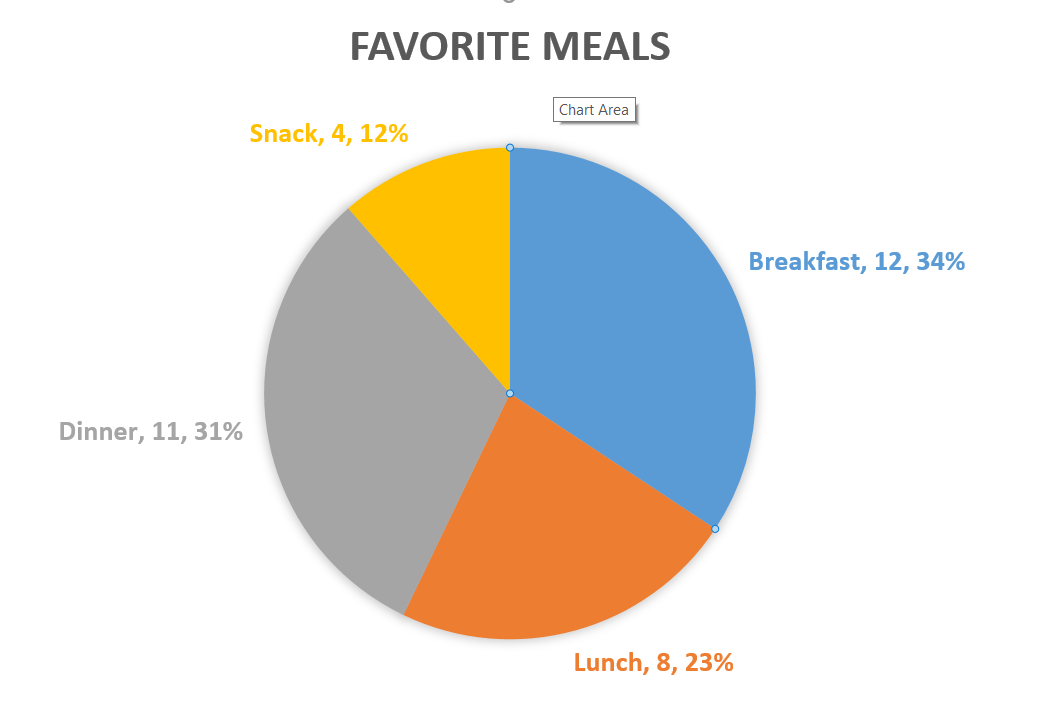
11
400
Simplify the expression using PEMDAS.
5 x (8 + 1 ) - 3
42
400
What is the most popular sport according to the tally chart?
Hockey
400
Solve for x. Showing your work on both sides.
x ÷ 3 = 6
x = 18
400
What fraction of students chose apples as their favorite?
(hint: ___ out of ___ students chose apples)
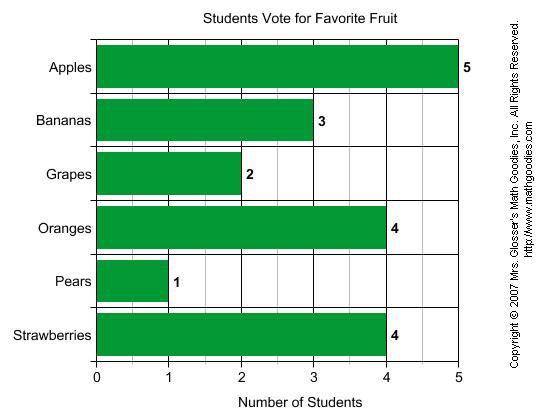
5 out of 19 students chose apples (5/19)
500
How many students are there in all?

35
500
Simplify the expression using PEMDAS.
(7 - 2) + 3 x 3
14
500
How many students are there in the class altogether?

18
500
Solve for x. Showing your work on both sides.
7x = 28
x = 4
500
How many more students prefer breakfast to a snack?
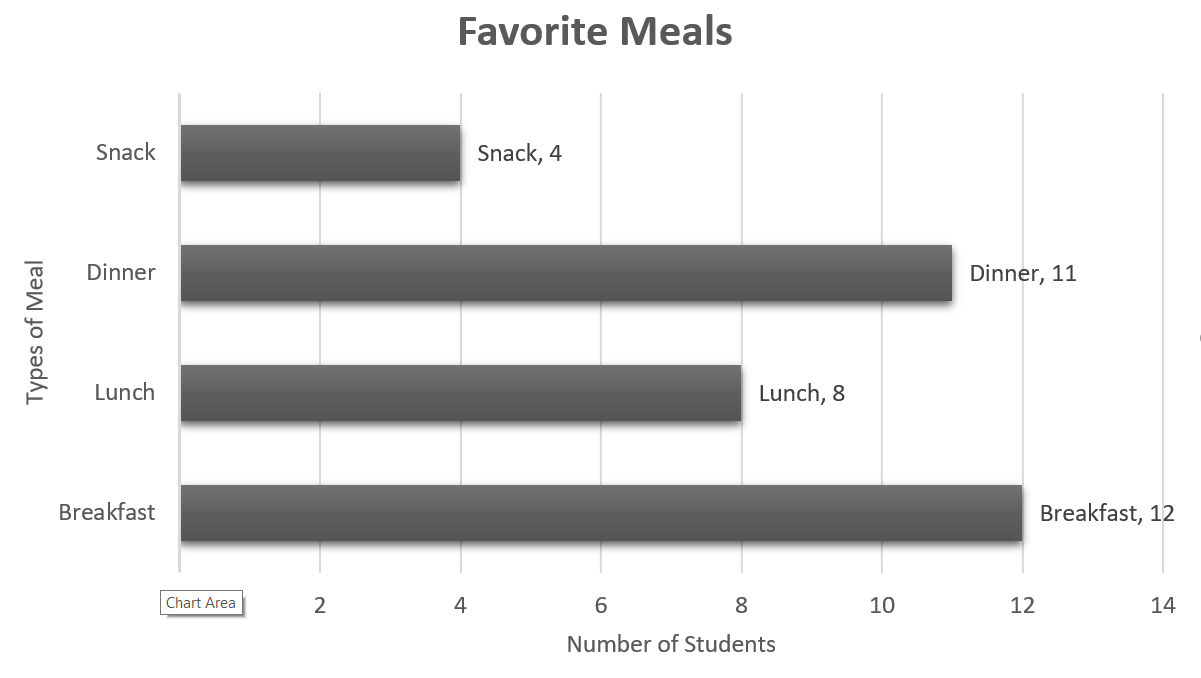
8 more students prefer breakfast
(12 students - 4 students = 8 students)