Population Growth
Limiting Factors
100
What type of graph represents the growth for a population that has unlimited resources and no limits?
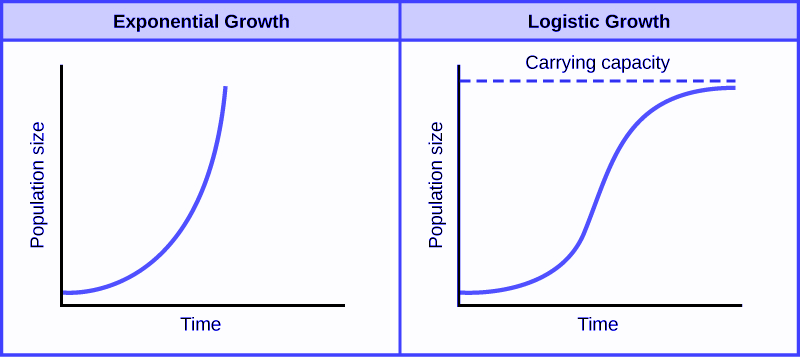
Exponential Growth
100
Identify which limiting factors are Biotic and Abiotic:
Mates, Competition, Climate, Disease, Pollution, Natural Disasters
Biotic: Mates, Competition, Disease
Abiotic: Climate, Pollution, Natural Disasters
200
Why did the population growth stop at III - IV
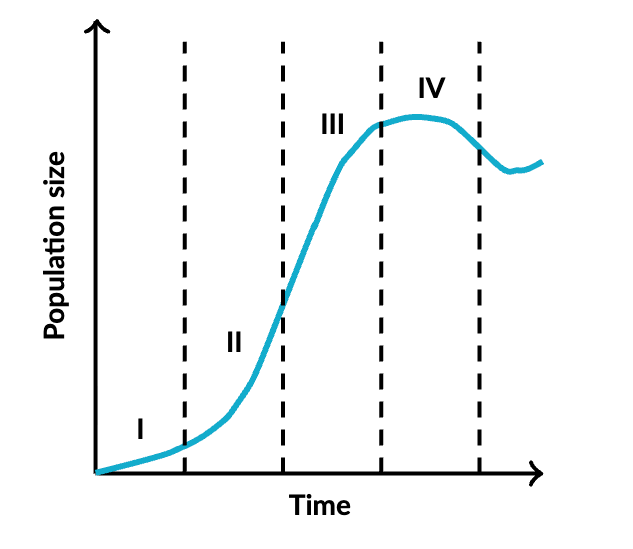
Reached carrying capacity
200
Which type of limiting factor effects all populations equally, regardless of how dense/crowded it is?
Density-Dependent or Density-Independent
Density-Independent
300
The population growth of a flock of birds is shown below. Deforestation leads to half of their forest being cut down. What would happen to the carrying capacity of this population of birds?
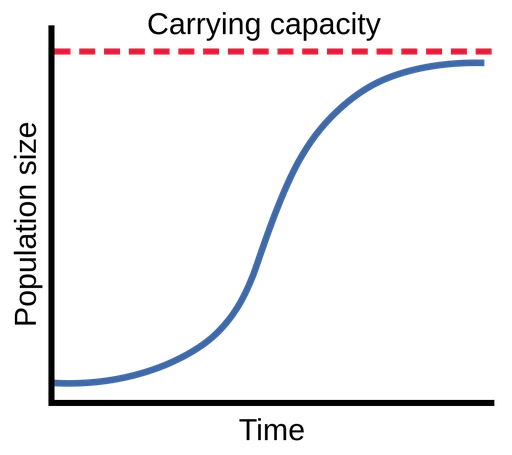
The carrying capacity would decrease (due to lack of shelter and food).
400
The graph below shows the relationship between a frog and an insect. Why does the population of frogs go up when the population of insects increases?
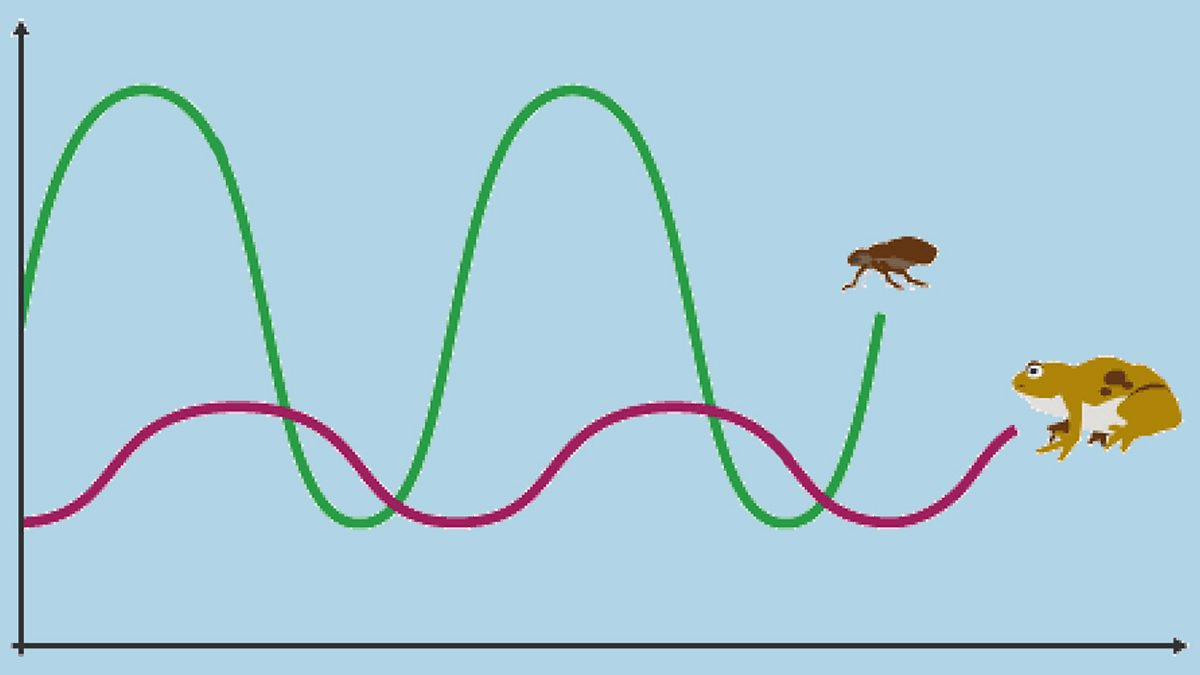
There is more food available for the frog, so the population increases
400
An oil spill in the Gulf of Mexico causes hundreds of fish to die. What type of limiting factor is this? (Density-dependent or Density-independent)
Density-Independent
500
California saw a record amount of rainfall in Winter of 2023. This caused hillsides all over Socal to explode with plant growth. What do you expect happened to the population of rabbits living on these hillsides? Rabbits eat grass.
The population of rabbits should have increased
500
In a pond, a very large population of fish are struggling to grow due to a lack of food, space, and mates to go around.
Is this limiting situation density-dependent or density independent?
Density dependent
(Food, mates, crowding fish)