Vocabulary
Populations and Samples
Analyzing Data
Comparing Populations
Miscellaneous
100
What is another word for mean?
Average
100
Who has the greatest overall population of the following two options:
A) New Jersey
B) America
America
100
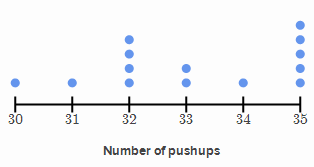
Tristan says the mode is 5. Is he correct? Why or why not?
No, the mode is 35.
100
Distribution C has median 24 and IQR 6.
Distribution D has median 29 and IQR 11.
Compare both center and variability.
D has the greater median by 5, so its typical value is higher.
C is more consistent because its IQR is 6 rather than 11
100
What measure of variability is used with the median?
IQR
200
What does M.A.D. stand for?
Mean Absolute Deviation
200
Is this a biased or random sample:
Doing a school survey, but only surveying those with green eyes.
Biased.
200
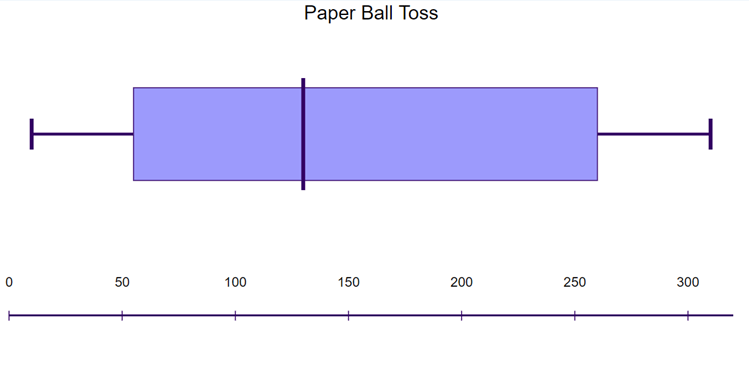
What is the best estimate for the center of this box plot?
Anywhere from 100-150. Probably a little closer to 150.
200
Distribution A has mean 18 and M.A.D. 2.1. Distribution B has mean 18 and M.A.D. 5.4.
Which distribution is more consistent? Explain.
A is more consistent because its M.A.D. of 2.1 is smaller. Both have the same center.
200
What is the 5 number summary?
1) Minimum
2) Median of Q1
3) Median
4) Median of Q3
5) Maximum
300
What is the difference between finding the population and finding the sample?
The population is the entire group and the sample is just a part of it.
300
Is this a random or biased sample?
Finding out how many pets students have by drawing 200 random names out of a hat.
Random
300
How do I find the interquartile range?
Subtract Q3 and Q1
300
Set A: 2, 10, 6, 8, 2, 9, 11
Set B: 4, 8, 6, 9, 5, 12, 15
Which set has a greater IQR?
Set A: 2, 2, 6, 8, 9, 10, 11 = 10-2 = 8
Set B: 4, 5, 6, 8, 9, 12, 15 = 12- 5 = 7
Set A has a greater IQR
300
Which measure of center is best to use when an outlier is present?
Median
400
What is an example of a MEASURE OF CENTER?
Mean OR Median
400
An optional survey link is posted on the school website. What sampling problem may occur?
Voluntary-response bias; students with stronger opinions may be more likely to answer.
400
If 12 out of 100 seventh graders hate pizza, how many seventh graders would hate pizza out of 300?
36
400
Set A: 15, 18, 21,
Set B: 4, 6, 8
Which set has a greater M.A.D?
Set A= 2
Set B= 1.33
Set A is larger
400
Which measure of center do you use when there is not an outlier? Also, what is the measure of variability that relates to this center?
Mean, MAD
500
What is an example of a MEASURE OF VARIABILITY?
IQR or Mean Absolute Deviation
500
Is this a biased or random sample?
Asking students walking out of band what the best elective is.
Biased
20 Bonus points if you can give me the random version of this sample.
500
In a survey, 3 out of 25 students said that they like raisins. If there are 200 students in the school, how many can we expect not to like raisins?
176
500
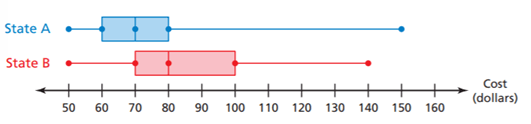
This box plot shows the cost of speeding tickets in 2 states. Julia got a $90 speeding ticket. Which state did she most likely get this ticket in? Why?
State B. The costs are generally higher. They have a mean of 80. Most of the data is between 70 and 100 in State B.
500
Set E: 6, 8, 10, 12, 14.
Set F: 2, 6, 10, 14, 18.
Find the mean and M.A.D. of each
Which one is more consistent?
Both means are 10.
E absolute deviations: 4, 2, 0, 2, 4; M.A.D. 2.4.
F deviations: 8, 4, 0, 4, 8; M.A.D. 4.8.
E is more consistent.