The Metric System
The Scientific Method
Graphing Techniques
Table & Graph Analysis
About Mr. Tull
100
This is the metric base unit for volume.
Liters
100
These types of observations are often numerical and refer to how many of something there is.
Quantitative Obersvations
100
This is how data is most often represented in a pie chart.
Percentages.
100
Students Favorite Shoe Brands
Nike 80
Reebok 25
Adidas 54
Puma 15
Vans 62
Converse 49
This is the type of graph best suited for the data above.
Bar Graph
100
This is Mr. Tull's first name.
Dylan
200
This is the metric prefix that means 1000
kilo-
200
Grace is performing an experiment where she is testing her accuracy of penalty kicks on an open net. She takes 7 penalty kicks into each spot of the goal. She is tracking her success and failures of making the goal in the correct area of the goal.
This is the independent variable in Grace's experiment.
Spot in goal where she kicks the ball.
200
This is the variable that goes on the y-axis
Dependent Variable
200
Students Favorite Shoe Brands
Nike 80
Reebok 25
Adidas 54
Puma 15
Vans 62
Converse 49
This is the MOST appropriate scaling for the data above.
5
200
This is the subject that I teach my 11th grade students.
Chemistry
300
Complete the following conversion:
1 m = _______ mm
1000 mm
300
Grace is performing an experiment where she is testing her accuracy of penalty kicks on an open net. She takes 7 penalty kicks into each spot of the goal. She is tracking her success and failures of making the goal in the correct area of the goal.
These are 2 control variables in Grace's experiment.
Same Soccer Ball
Same Foot kicked
7 attempts at each spot
(answers vary)
300
This is the type of graph that would best suit an experiment where I want to measure the weight of my dog over the span of his lifetime.
Scatter Plot
300

These categories make up 50% of the pie chart (Hint: Two Solutions)
Anime & Reality
Documentary & Drama & Comedy
300
This is the college that Mr. Tull attended
Millersville University
400
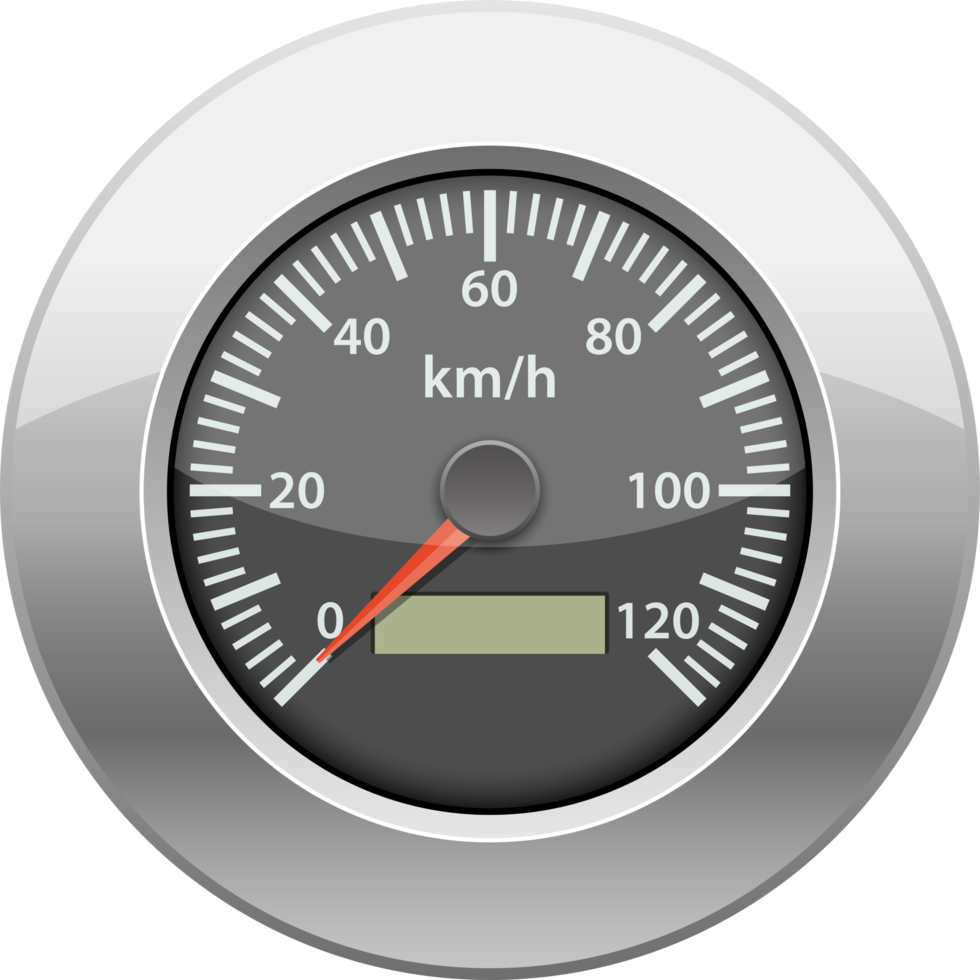
This is the increment of above speedometer.
2
400
Grace is performing an experiment where she is testing her accuracy of penalty kicks on an open net. She takes 7 penalty kicks into each spot of the goal. She is tracking her success and failures of making the goal in the correct area of the goal.
This is an acceptable research question for Grace's experiment.
How does changing where I kick a soccer ball for a penalty kick affect my accuracy on goal?
400
Grace is performing an experiment where she is testing her accuracy of penalty kicks on an open net. She is tracking her success and failures of making the goal in the correct area of the goal.
This graph would best suit the scenario above.
Bar Graph
400

This is the group of days that has more people attend the movies between the weekend (Sat & Sun) and the other weekdays
The Weekdays
400
This is what district Mr. Tull's girlfriend teaches in.
Central York
500
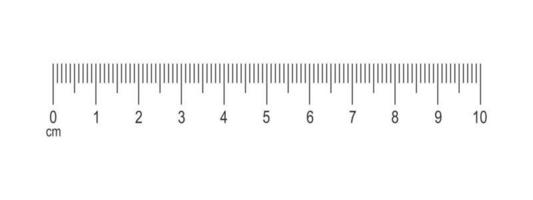
If the length of an object was exactly on the 6 cm tick mark, this would be its exact measurement.
6.00 cm
500
These are the words you should use instead of right/wrong and correct/incorrect when making a conclusion from your data.
Supported/Not Supported
500
When creating a title for a graph, this is the order of the dependent and independent variable.
y vs. x
500

Units for average price
500
This is how much money Mr. Tull has won playing pickleball.
$100