Set the Table
Where it's at?
How's it going?
Got Change?
100
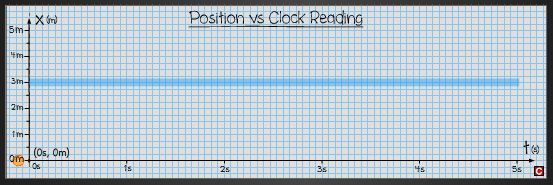
Complete position and time data table for this graph:
100
What is the position at: 3s
3m ( the object is AT REST)
100
What is the velocity at the time: 3s
0 m/s (it's AT REST)
100
Does either the position and/or the velocity represented in this graph change?
The object is at rest, so there is no change in position or velocity.
200
Complete position and time data table for this graph:


200
What is the position at: 4s
2m
200
What is the velocity at the time: from 1s to 3s?
-2 m/s
200
Does either the position and/or the velocity represented in this graph change?
The position changes from 10m to 2m.
The velocity is constant and negative.
300
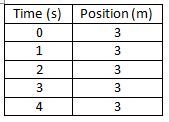
Complete position and time data table for this graph:

300
What is the position at: 4s
6m
300
What is the velocity at the time: 1s to 3s
3 m/s
300
Does either the position and/or the velocity represented in this graph change?
The INITIAL and FINAL positions are the same (0m).
The velocity does change (overall) from constant and positive to constant and negative.
400
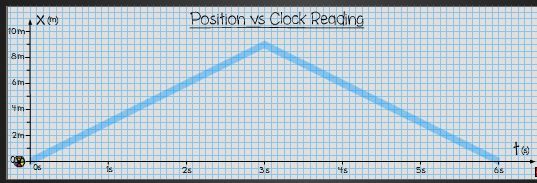
Complete position and time data table for this graph:

400
What is the position at: 3s
0m
400
What is the velocity at the time: 2s to 4s
4 m/s
400
Does either the position and/or the velocity represented in this graph change?
The initial and final positions are different (-4m and 4m).
Overall the velocity does change from at rest to constant and positive, and back to at rest.
500
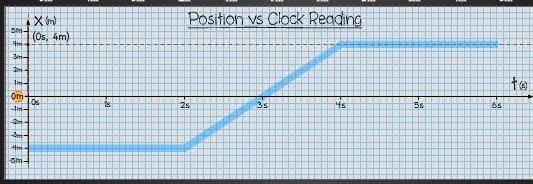
During which time interval does the displacement change the most?

Between 5s and 6s (that is where the slope of the line is the steepest)
500
What is the position at: 6s
-8m
500
Does this graph show an object with a constant or changing velocity?
Changing velocity (because it is a curve!)
500
Does either the position and/or the velocity represented in this graph change?
The position changes from positive to negative.
The velocity is changing (increasing and negative)