T/F
What's Wrong?
Correct Usage
Vocab
Coms Questionnaire
100
The audience experiences speeches through all 5 senses.
True
100
What are 3 things wrong with this slide?
Font, slide background, Font color, the picture, etc
100
When should you use a bar graph?
When showing the differences between quantities. (Demographics or costs)
100
Low-Tech Presentation aid
These presentation aids are physical forms or aids that don't utilize technology.
100
What happens when your phone goes off in class?
You have to bring in food next class
200
As long as the speaker has good delivery, presentation aids do not matter.
False
200
For an assignment sally had to do a 10-minute speech. In her speech she spoke for 3 minutes, then played a 6-minute video, followed by a 1-minute conclusion.
What was wrong with her speech?
Videos should be presentation aids and not the presentation itself.
200
In Anatomy, when examining body parts what visual should the teacher use?
A) Diagram
B) Chart
C) Graph
A
200
Presentation aid
They improve the audiences understanding, memory, retention, and increase the speaker's credibility.
200
What is our room number?
301
300
There is never a good reason to use a dry-erase board in your speech.
False
300
What are 5 things wrong with this slide?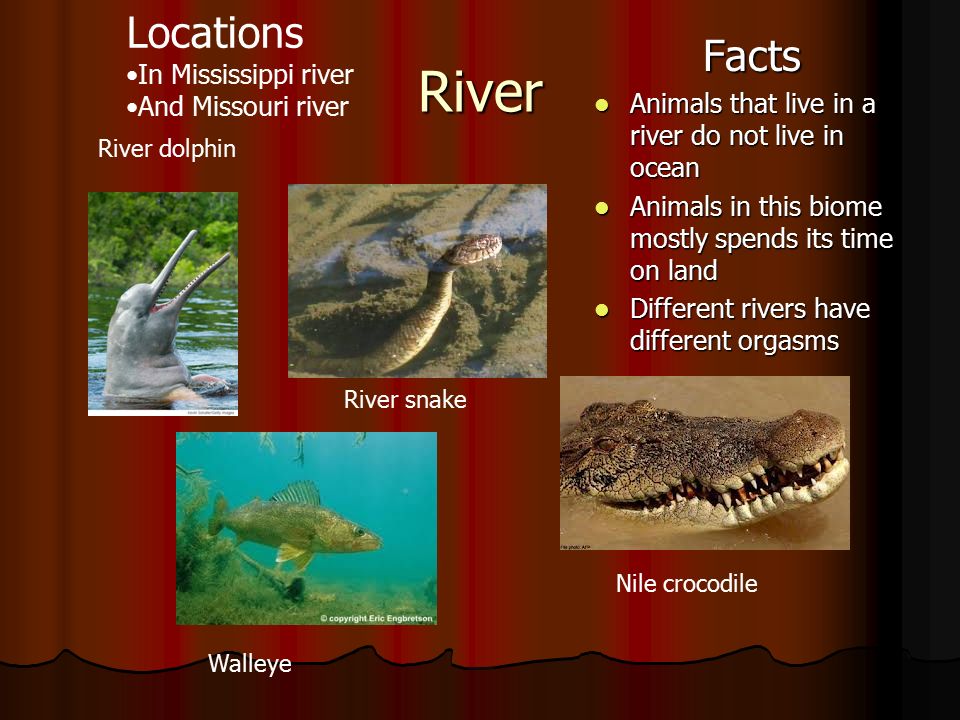
Format: there is no structure among this slide.
Context: The pictures do not line up with the information presented.
Grammar: Spelling and punctuation mistakes.
Background: Is not pleasing
Font: 4-5 different font sizes
Answers can vary
300
What type of presentation aid would you use when comparing North and South Korea?
Any form of PowerPoint
300
7x7 Rule
There should be no more than 7 horizontal lines of wording and each of these lines should have no more than 7 words.
300
What is the most common name in this class?
Tommy
400
Consistency has an important role on the rhythm of your presentation.
True
(Give one example of how to improve consistency in a presentation)
400
For a presentation aid, you decided to use a handout. When it was time for the handout, you had to go around and pass them out. During this you notice people start to go on their phones and talk to each other. What did you do wrong? How could you prevent this?
Passing out handouts in the middle of your presentation can ruin the flow.
In the future, see if you can enter the venue early and pass out the handouts before. This way, you do not lose anyone in the middle of the speech.
400
When should you use a graph and a chart?
Use a graph when wanting to look at trends overtime. Use a chart when looking at present data and predictions.
400
Rhythm
A consistency or flow of pace.
400
How many countries has our professor visited?
15
500
People and animals are both great physical presentation aids
False
Why?
500
What's wrong with this graph?
This graph has too much clutter.
500
When should you use a decision tree?
When displaying a thought process. These charts typically branch out. An example of this would be sharing an idea, then having it branch off to advantages and disadvantages.
500
Tone (what creates it?)
The overall feel or mood of the presentation created by images, font, colors, etc.
500
A few weeks back, we had gone over types of listening. Following this chapter, we had an activity where our professor told a story to a student. This student had to repeat it to someone else. What was the name of the woman in the story?
Elizabeth Johnson