Probability Tree
Mean, Median, Mode
Range & IQR
Boxplots
IQR
100
A type of graph that shows all of the possible outcomes using branches that spread out
Tree Diagram
100
The average of all the numbers in the data
Mean
100
What is the formula for range?
Range = Max- Min
100
What is the median (Q2) of this boxplot?
7
100
What is the 5th Step to solve IQR?
Find the median of your lower (Q1) and upper (Q3) halves of your data.
200

1/4 or 25%
200
The number or value that appears the most
Mode
200
What does IQR stand for?
Interquartile range
200
What is the range of this boxplot?
9 - 2 = 7
200
What are the 2 halves of your data?
Lower and Upper
300
What is the probability of getting one head and one tail?
1/2 or 50%
300
The middle data point is called the...
Median
300
What is the formula for IQR?
IQR = Q3 - Q1
300
What is the IQR of this boxplot?
8 - 3 = 5
300
The variation or spread of the data is large
The IQR number is large
400
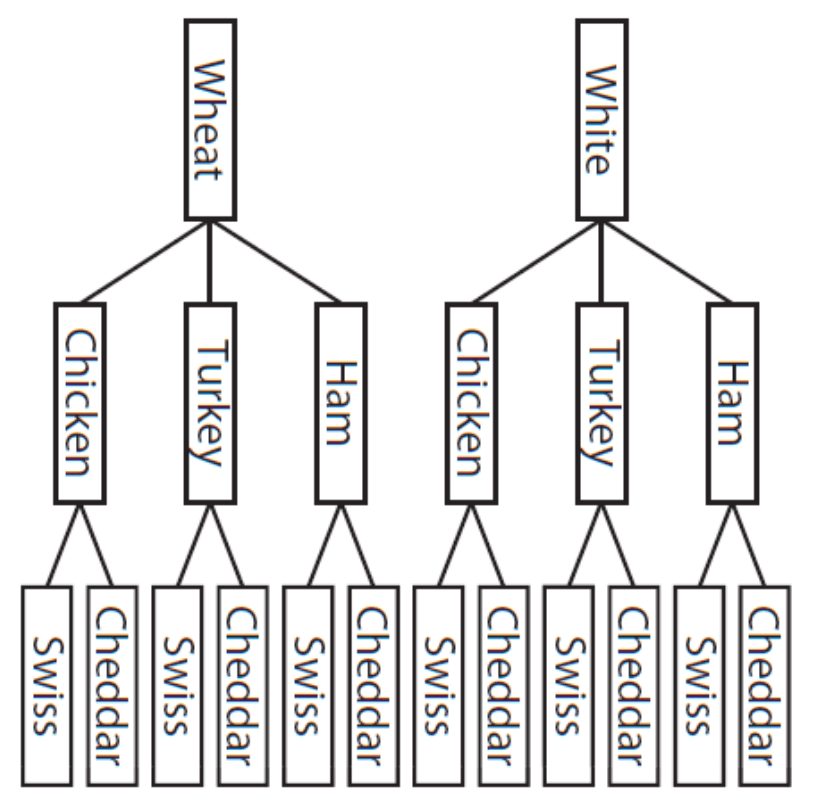
What is the probability of choosing a sandwich with swiss cheese?
1/2 or 50%
400
{9, 10, 12, 13, 13, 13, 15, 15, 16, 16, 18, 22, 23, 24, 24, 25}
What is the median?
15.5
400
The 3 letters used for Interquartile Range
IQR
400
Does boxplot 1 or 2 have a greater range?
2
400
The variation or spread of the data is small
The IQR number is small
500
Find the probability of choosing a sandwich with chicken or ham.
2/3 or 67%
500
{9, 10, 12, 13, 13, 13, 15, 15, 16, 16, 18, 22, 23, 24, 24, 25}
Calculate the mean.
16.75
500
If Q1 is 36 and Q3 is 79, what is the IQR?
IQR = 43
500
Draw a box plot with the following:
Minimum is 1
Quartile 1 is 7
Quartile 2 is 8
Quartile 3 is 10
Maximum is 14
Mr. Holguin will judge your drawings!
500
What can be used to show IQR
Box Plot
or
Box and Whisker Plot