Unit Rates
Proportional Tables
Proportional Graphs-Unit Rate
Linear Graphs
Better Buy
100
It is $39.96 for 4 pizzas. How much is it for 1 pizza?
It cost $9.99 for 1 pizza
100
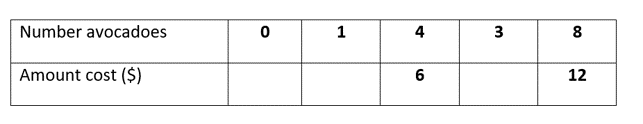
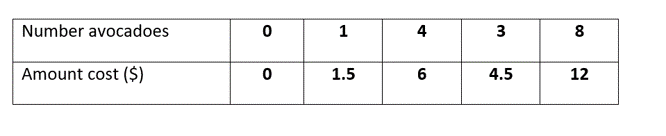
Complete the proportional table.
100
What is the unit rate?

4:1
100
True or False: For a linear graph to be proportional, it must be in a straight line.
True
100
What's the better buy?
$6.36 for 3 bowls or $11.25 for 5 bowls?
$6.36 for 3 bowls
200
Sally can jump 36 times in ½ minute. How much can she jump in 1 minute?
Sally can jump 72 times in 1 minute.
200
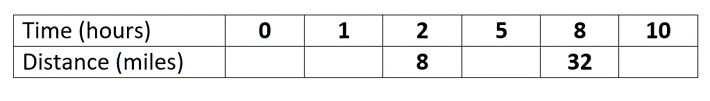
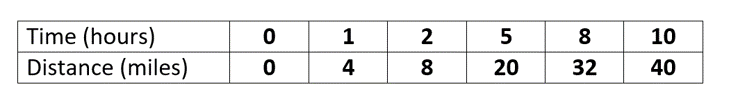
Complete the proportional table.
200
What is the unit rate?

5:1
200
True or False: For a linear graph to be proportional, it must be a straight line and can start anywhere on the Y axis.
False
200
What's the better buy?
35 oz of peanut butter for $5.19 or 16 oz of peanut butter for $2.49?
35 oz for $5.19
300
Cassandra bought three pounds of potatoes for 8.25. How much is one pound of potatoes?
$2.75 per pound
300
Is the table proportional? Explain.
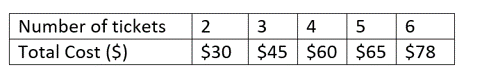
No, they do not have the same unit rate.
300
What is the unit rate for the following proportional graph?
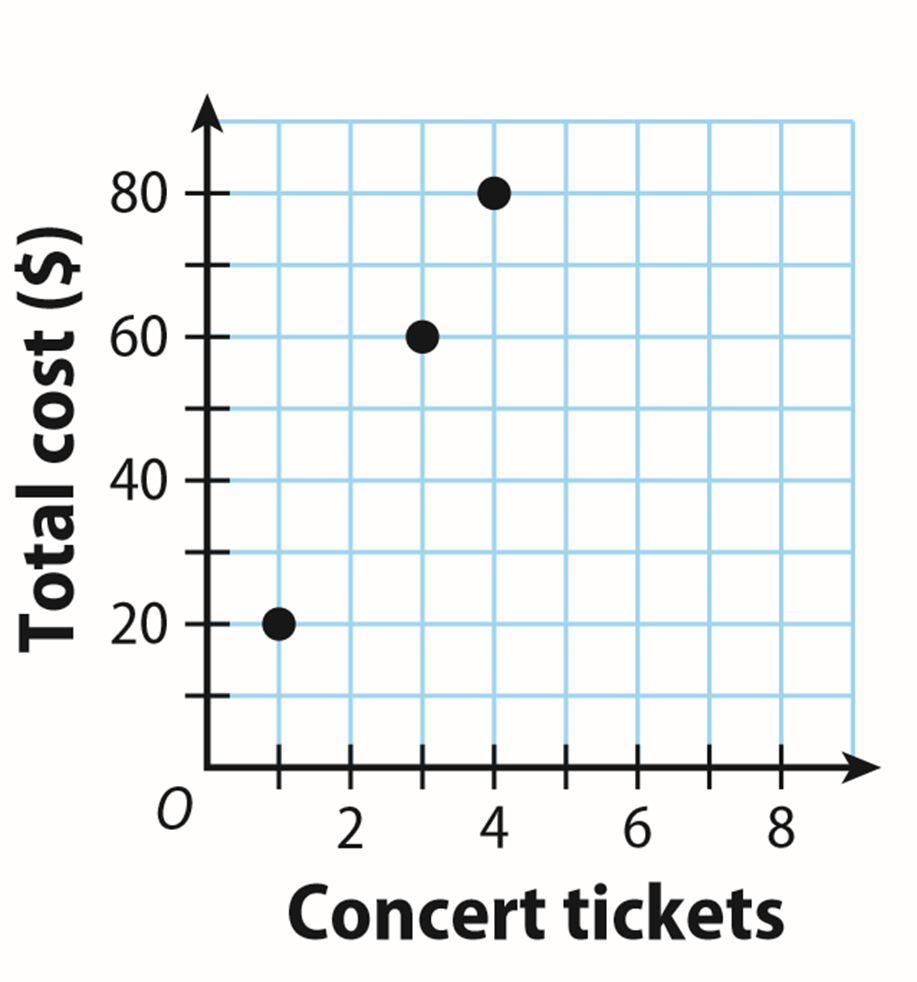
$20 per ticket or 20:1
300
Is this linear graph proportional?

Yes
300
What's the better buy?
$2.67 for 3 single lemons or $3.99 for a pack of 6 lemons?
$3.99 for a pack of 6 lemons
400
John bought 5 books for $42.50. How much is 1 book?
It cost $8.50 for 1 book.
400
Is the table proportional? Explain.
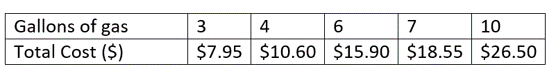
Yes, it has the same unit rate of $2.65.
400
What is the unit rate?
2:1
400
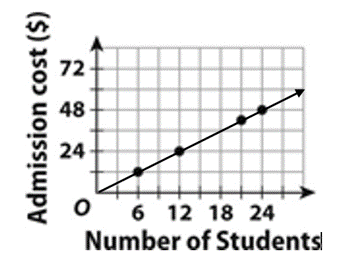
Is this linear graph proportional? Explain why or why not.

Yes because it starts at the origin and it's a straight line.
400
What's the better box?
3 pints of milk for $4.13 or 7 pints for $8.26
7 pints for $8.26