Graphing Proportional Relationships
Equations of Proportional Relationships
Identifying Proportional Relationships
Proportional Relationships
Word Problems
Comparing Relationships
100
What is the ordered pair of the origin?
(0,0)
100
In the equation y = 3x, what is the constant of proportionality?
3
100
True or False?
To find the constant of proportionality, you divide “x” by “y.”
FALSE
100
In an ordered pair (x, y) that represents the unit rate, which coordinate is 1?
x
100
Ms. Cervantes is selling shirts for a fundraiser. She is plotting points on a graph to show her students how much she makes, in $. What would the point (1,8) mean in this situation?
Each shirt costs $8.
100
Which graph shows a proportional relationship between x and y?
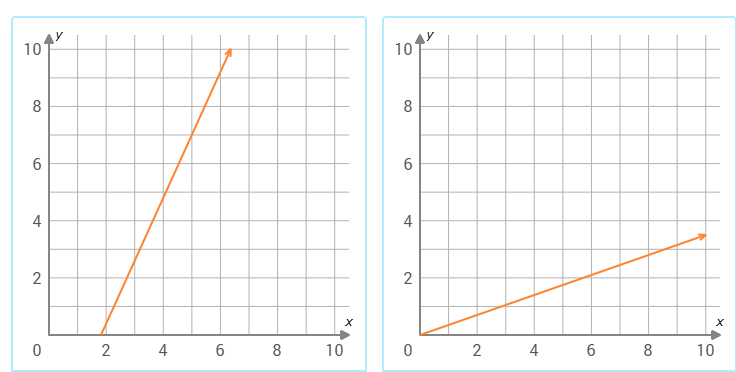
Graph B because it goes through the origin.
200
Does this graph represent a proportional relationship? and how do you know 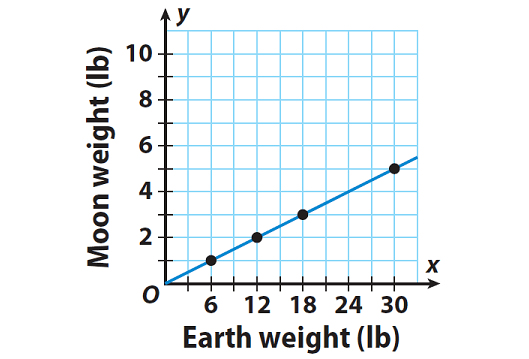
Yes, because the line goes through the origin.
200
Every proportional equation can be written in what form?
in the form of y=kx and nothing added or subtracted to it.
200
Does this graph show a proportional relationship? How do you know?

NO
Does not start at the origin
200
If the point (4, 3) is on the graph of a proportional relationship, what is the constant of proportionality?
3/4
200
Ms. Cervantes is selling shirts for a fundraiser. She is plotting points on a graph to show her students how much she makes, in $. What would the point (0,0) mean in this situation?
If she sells 0 shirts, she will make $0.
200
Which graph(s) show a proportional relationship between x and y? Explain
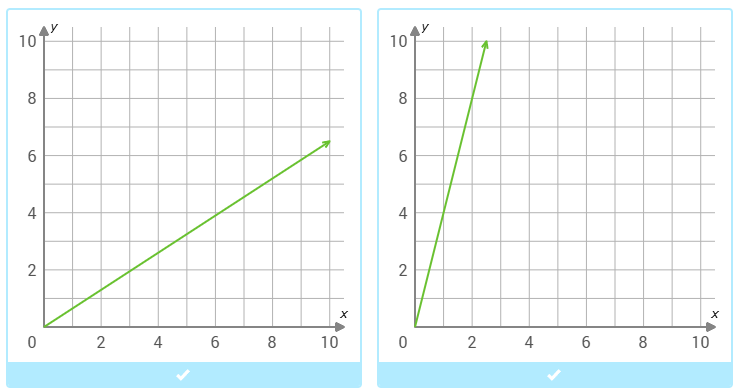
Both because they both go through the origin.
300
What two characteristics make a graph proportional?
Straight line
Starts at the origin (0,0)
300
Will the graph of the equation y = 3x + 5 be a straight line that starts at the origin?
no
300
(5,10) is a point on a line that represents a proportional relationship. What is the constant of proportionality?
2
300
What is the rate of apples to trees?
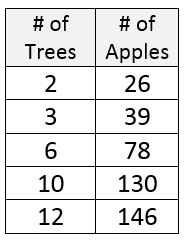
13 apples per tree
300
Ms. Cervantes is selling shirts for a fundraiser. She is plotting points on a graph to show her students how much she makes, in $. What would the point (18,144) mean in this situation?
It means that when Ms. Cervantes sells 18 shirts, she will make $144.
300
The graph shows the price of blueberries at two different stores (Store A and Store B). Which one has a better price? Explain
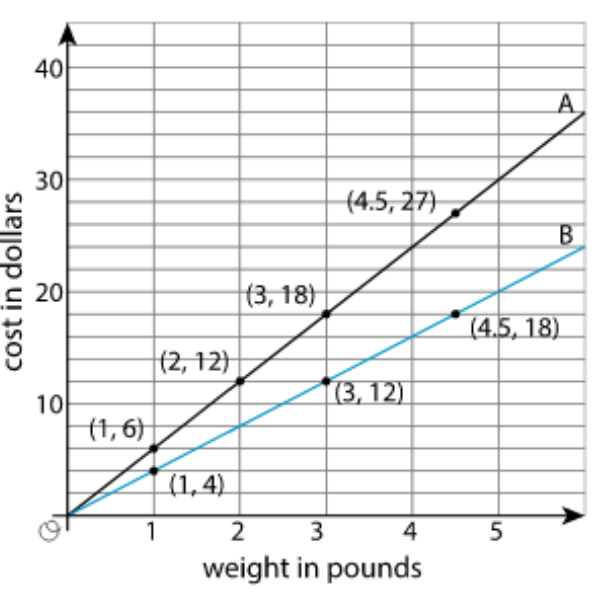
Store B, because it's less steep which means the price per pound (k) is lower.
400
Is this a proportional relationship? Explain
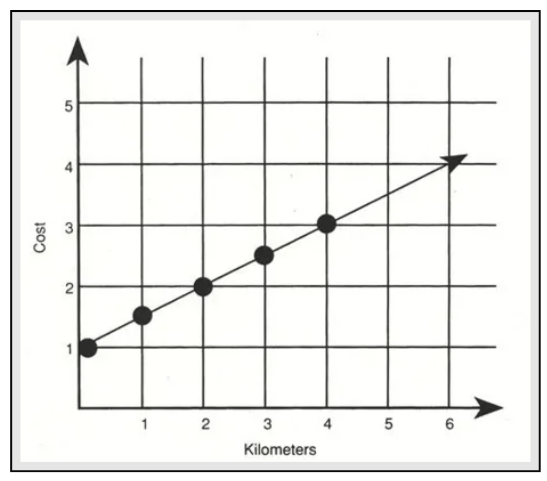
No, line doesn't go through the origin.
400
Is this equation proportional? y= (¾)x
yes
400
Does the table show a proportional relationship? If so, what is the constant of proportionality?

Yes; k=9
400
When creating this game, Mrs. Packer was able to create 3 questions every 5 minutes. How long would it take to create a game with 24 questions?
40 minutes
400
Ms. Cervantes is selling shirts for a fundraiser. She is plotting points on a graph to show her students how much she makes, in $. The equation for this situation is y=8x. Would the point (8, 62) be on this graph?
No. The point would be (8, 64).
400
Two people walked a marathon. Which person was walking faster? Person A or Person B? Explain

Person B because they are walking at a rate of 1.25 miles per hour and person A is walking around 0.6 miles per hour. (steeper line = faster speed)
500
What is the constant of proportionality? Use units.
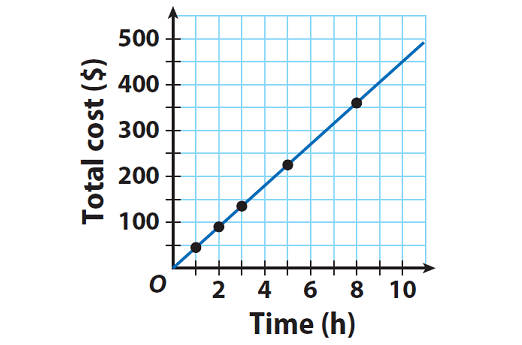
k=$50 per hour
500
If the constant of proportionality is 0.25, what is the equation for this relationship?
y = 0.25x
500
How do you know if a table is proportional?
When you divide the y value with its x value, you get the same constant of proportionality in each row.
500
A recipe for chocolate chip muffins needs 4 cups of flour to 1 cup of chocolate chips. Which of the following shows another correct ratio for the recipe?
a. 1 cup of flour for 1 cup of chocolate chips
b. 3 cups of flour to 1 cup of chocolate chips
c. 8 cups of flour to 2 cups of chocolate chips
c
500
Ms. Cervantes is selling shirts for a fundraiser. She is plotting points on a graph to show her students how much she makes, in $. The equation for this situation is y=8x. Would the point (73, 584) be on this graph?
Yes. When Ms. Cervantes sells 73 shirts, she will make $584.
500
The graph shows both proportional relationships.
Fruit World: c = 0.6w
Veggie Mart: c = 1.15w
Which line represents the cost of the tomatoes at Veggie Mart? Explain

The top (more steep line) because Veggie Mart's tomatoes cost more at $1.15 per pound.