Experimental Design
Measurement
Graphing
200
This protects the validity of your experiment by keeping things that might effect the IV and DV the same.
Constants
200
Distance is measured in _______
Meters
200
What is the format for titling a graph?
Dependent Variable (y-axis) vs Independent Variable (x-axis)
400
This represents what should normally happen when the IV and DV come together.
The Control
400
What temperature scale is used for really cold temperatures?
Kelvin
400
Why are graphs important in Science?
To give a visual representation of data, help us analyze data.
600
What do we do during an experiment to minimize errors?
Repeated trials
600
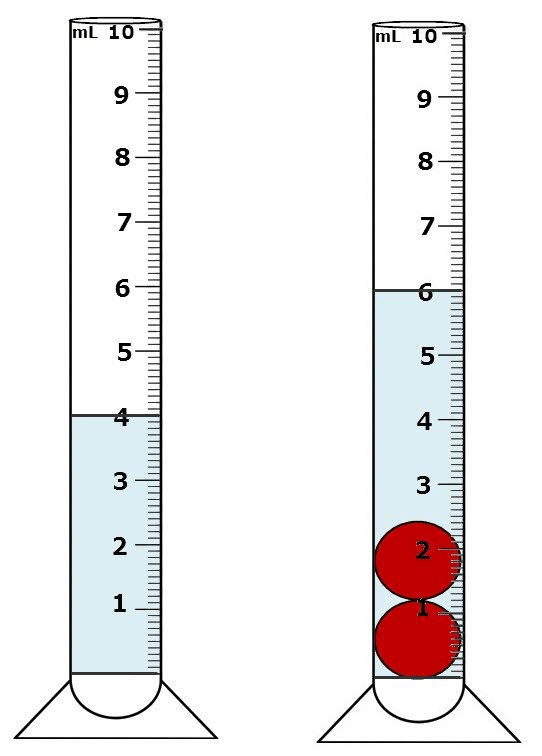
What would you do if you wanted to measure the volume of an irregular object?
Hint: You need water
Water displacement
600
When doing repeated trials how do you determine the average?
Add them up and divide by the number of trials
800
If the Dependent Variable (DV) is number the data is ________?
Quantitative
800
What is 0 degrees Kelvin called?
Absolute Zero
That is -273 degrees Celsius
800
What do you call a line graph when the data points don't form a line?
Nonlinear
1000
If the Dependent Variable (DV) is descriptions, pictures or words that data is ______?
Qualitative
1000
Name the prefixes for metric conversion .. remember King Henry Doesn't usually drink chocolate milk
Kilo, Hecto, Deca, unit (meter,liter,gram)
deci, centi, milli
1000
Describe the correlation of each Scatter Plot.
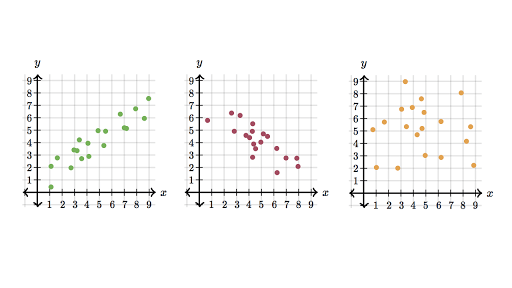
Positive, Negative, No correlation