THE BASICS
MEASURES OF CENTRAL TENDENCY
VARY FUN!
LOCATION, LOCATION, LOCATION
RANDOM
100
Techniques used to summarize and interpret large amounts of information (data) to answer questions
What is STATISTICS?
100
The mode from the set of data 8, 18, 12, 26, 18, 19, 5
What is 18
100
The square root of variance.
What is STANDARD DEVIATION
100
The z-score formula for a sample of individual scores.
What is (X - M)/s ?
100
The type of graph that represents data using vertical bars of various heights that indicate frequencies for continuous data.
What is a Histogram?
200
The level of measurements where items are classified by categories or traits (such as eye color)
What is NOMINAL?
200
The mean from the set of data 2, 8, 10, 16, 18, 20
What is 12.3
200
The variance if the standard deviation is .60.
What is .36
200
The z-score for a batter who normally averages .3, with a standard deviation of .05, if he scores .420 for one game.
What is 2.4?
200
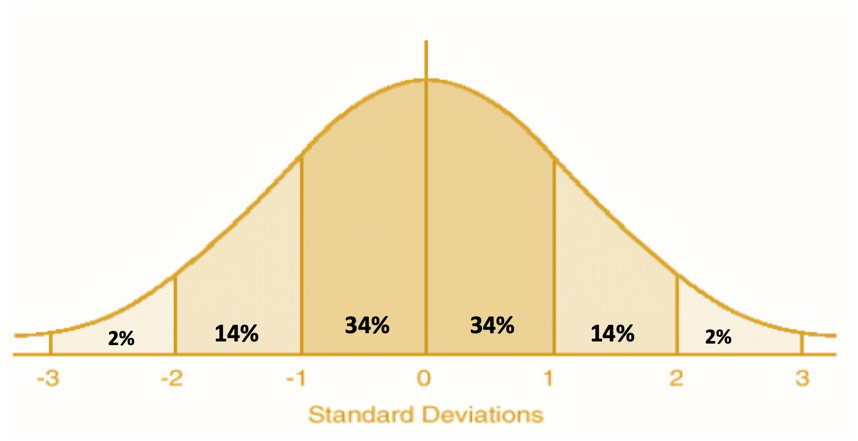
The estimated values for the proportions of scores that typically fall within 3 standard deviations of a mean, given that the scores are normally distributed. (Draw a curve and label!)
300
The level of measurement where there exists a true zero.
What is RATIO?
300
The median from the set of data: 6, 2, 5, 8, 19, 5, 20
What is 6
300
Variability calculations such as standard deviation and variance measure the _______ of scores.
What is spread?
300
A z-score tells us the number of these a score is from a mean.
What are standard deviations?
300
According to the Central Limit Theorem, if N is large (N = 30 or more), then the mean of the distribution of sample means is called the Expected Value of M (μM) and is equal to _________.
What is the population mean (μ)?
400
The type of study where a researcher manipulates one an independent variable and tries to determine how it influences other variables.
What is EXPERIMENTAL?
400
A z-score distribution has a mean of ____ and a standard deviation of _____.
mean = 0, sd = 1
400
The standard deviation of the scores 80, 60, 55, 60, 70
What is 8.94
400
For a sampling distribution of µ = 50 and σ = 10 for samples of n = 25, what is the probability of obtaining a sample mean of lower than 49?
30.85%
(z= -.5)
400
The size of the standard error (σM) decreases as the size of the sample _________.
What is increases?
500
A sample is considered a good sample if it is ______.
What is representative?
500
The measure of central tendency that should be chosen to describe a data set that is severely skewed.
What is the MEDIAN?
500
Find the IQR from the set of data 4, 8, 12, 20
What is 10?
(Q1=6; Q3=16)
500
The raw (individual) scores that mark the boundaries of the middle 30% of a normal distribution of M = 8, s = .3
X = 7.89, 8.11
500
The confidence interval (in APA format) for a group of students: (M=85, σ=6, N=30).
M = 85.00, 95%CI [82.86, 87.14]