Rate of Change
Comparing Rates
Scatter Plots
Data Tables
Functions
100
Find the Rate of Change
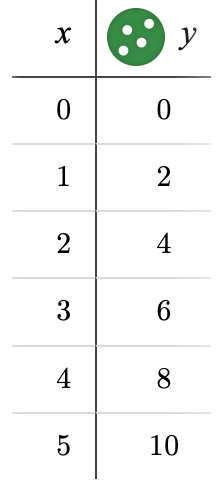
2
100
What is the initial value of Company A?
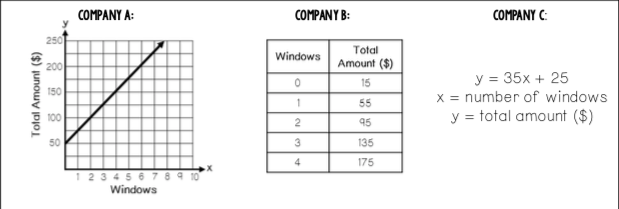
50
(the y-intercept)
100
Where should a line of best fit be drawn?
a) In the middle of the data with half above and half below the line
b) Connecting each data point by passing through each point
a) In the middle of the data with half above and half below the line
100
How many people were interviewed?
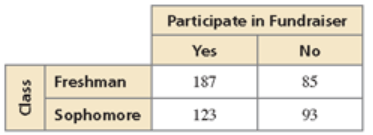
488 people
100
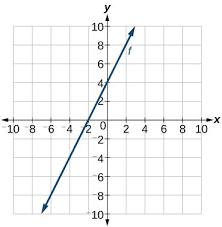
Is this graph a function?

no
200
Find the Rate of Change
2
200
Which company has the greatest rate of change?
Company B (40)
200
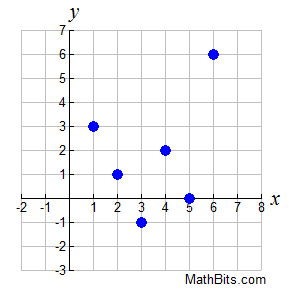
What are the three categories that we use to describe a scatter plots association?
Strength, Shape, and Direction
200
In the survey, what fraction of teens participated in the fundraiser?
310/488
200
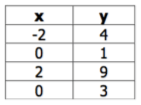
Does the table represent a function?

no
300
What is the Rate of Change

2/3
300
Create an equation in slope-intercept form to represent Company B
y = 15x + 40.
300
Describe this association
Positive, Non-Linear, Weak
300
In the survey, what fraction of teens who participated in the fundraiser were Freshman?
187/310
300
Does the graph represent a function?
yes
400
What is the equation of this graph?
y = 3 - 3/4x
400
Find the cost of installation if I hired Company C to install three windows
$130
(Plug in 3 for x into Company C's Equation)
400
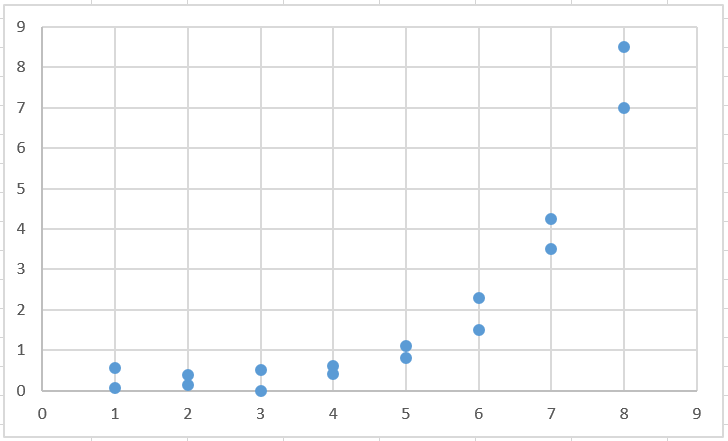
Using the scatterplot below, come up with a reasonable estimate for x when y = 60
20
400
In the survey, what percent of those who did not participate in the fundraiser were Sophomores?
52.25%
93/178
400
Does the graph represent a function?
yes
500
Create an equation in slope-intercept form that represents the table.
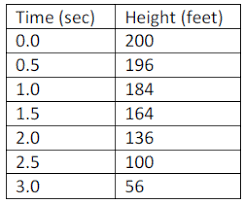
y=200-16x
500
Company D charges using the equation: y = 20x+100
After how many windows installed would it take for Company C and Company D to cost the same?
5 windows
(set equations equal to each other & solve for x)
500
List the following given the graph:
1) Direction. 2) Description of clusters. 3) Outlier/s
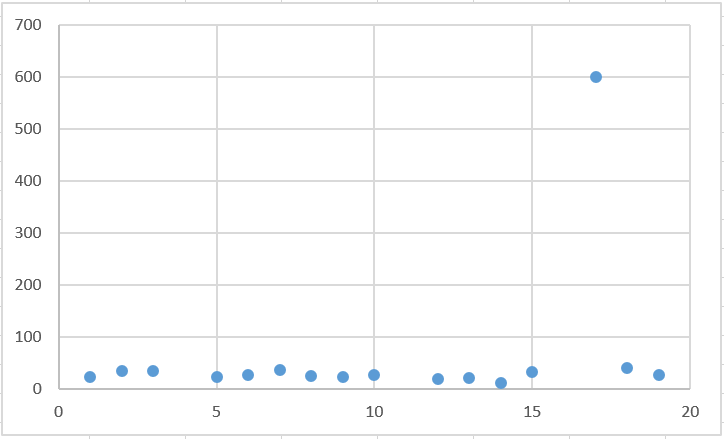
Direction: No association
Clusters: From 0-3, 5-10, 12-15
Outlier: (17,600)
500
In the survey, what percent of teens did not participate in the fundraiser and were Sophomores?
19.06%
93/488
500
Does this table represent a linear function?
no - does not have a constant rate of change