Graphing Proportional Relationships
Proportional Relationship Equations
Identifying Proportional Relationships
Proportional Relationship Problems
Proportion Word Problems
Ratio Tables and Unit Rates
100
What is the ordered pair for the origin?
(0,0)
100
Is the equation y = 3x proportional? Explain.
Yes. The equation is in the form of y = kx, where k = 3.
100
Are the ratios below proportional? Explain.
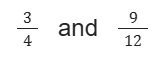
Yes. You can use a multiplier of 3 to get from the left fraction to the right fraction. Also, if you cross-multiply, the cross-products are equal (36 = 36).
100
The triangles below are similar. This means that the side lengths are proportional. What is the value of x?
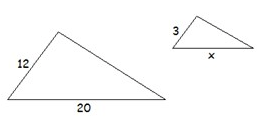
x = 5
Explanation: Since 12 divided by 4 is 3, then 20 divided by 4 is 5.
100
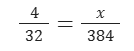
According to the scale on a map, 4 cm on the map equals 32 miles. How many centimeters on the map would represent 384 miles?
48 cm
Explanation: Set up a proportion and solve.
100
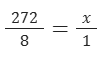
Sam took 8 hours to drive 272 miles. What was the unit rate in miles per hour?
34 mph
Explanation: Set up a proportion and solve.
200
How can you tell if a graph represents a proportional relationship?
The graph is a straight line that passes through the origin.
200
Is the equation y = 4x + 10 proportional? Explain.
No. The equation is NOT in the form of y = kx.
This is because of the + 10. If it was just y = 4x, then it would be proportional.
200
Does the graph below represent a proportional relationship? Explain.

No. Although the graph is a straight line, it does not pass through the origin.
200

Find the value of n in the proportion above.
n = 3.8
Explanation: Use cross-products to get the equation 30n = 114. Then divide by sides by 30.
200
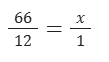
Bob ran 66 miles in 12 hours. How many miles did Bob run per hour? (This will be the unit rate.)
5.5 miles per hour
Explanation: Set up a proportion and solve.
200
What number must the denominator of a fraction (or second number in a ratio) be in order to have a unit rate?
1
300
Does every straight line graph represent a proportional relationship? Explain.
No. The graph would have to be a straight line AND pass through the origin.
300
What is the constant of proportionality in the equation below?
y= ¾ x
k = ¾
300
Does the table below represent a proportional relationship? Explain.

No. There is no k-value AND (0, 0) would not make sense in the table.
Example: For (1, 24), 1 x 24 = 24. But for (2, 45), 2 x 24 is 48 not 45.
300
The table below is proportional. Find the constant of proportionality.
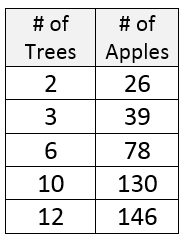
k = 13
Explanation: For (2, 26), 2 x 13 = 26.
300
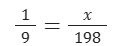
The scale factor for a model airplane to a real airplane is 1 in : 9ft. What would the length of the model plane be if the real plane is a 198 feet?
22 inches
Explanation: Set up a proportion and solve.
300
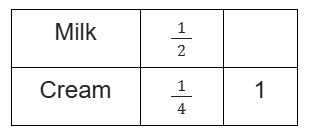
A recipe uses the following ratio:
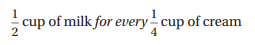
Write it as a unit rate.
____ cups of milk : 1 cup of cream
2 cups of milk : 1 cup of cream
Explanation: Use a ratio table.
400
Does this graph represent a proportional relationship? Explain.
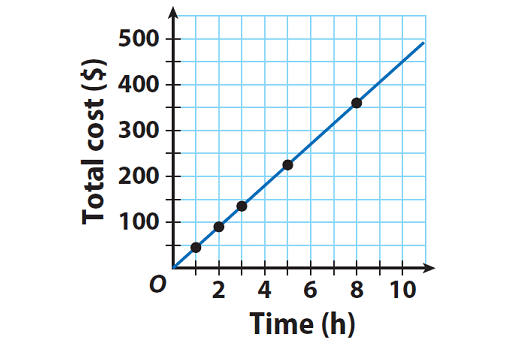
Yes. It is a straight line that passes through the origin.
400
The constant of proportionality for the graph below is 1/6. What is the equation? 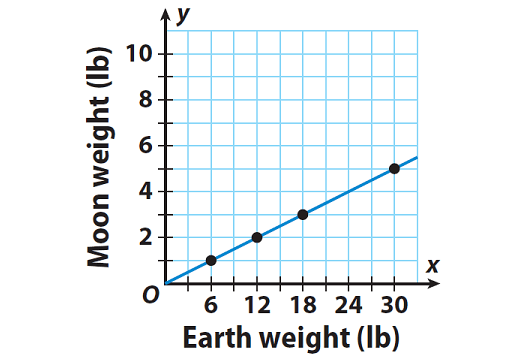
y = 1/6 x
400
Does the table below represent a proportional relationship? Explain.

Yes. The constant of proportionality (k-value) is 9.
Example: For (4, 36), 4 x 9 = 36. For (8, 72), 8 x 9 = 72. You can do this for the other two points, as well.
400
The constant of proportionality is 3. Write an equation for the proportional relationship.
y = 3x
Remember... a proportional relationship can be written using the equation y = kx.
400
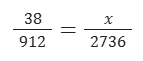
Steve’s car used 38 gallons of gasoline to go 912 miles. At that rate, how many gallons would be used to go 2736 miles?
114 gallons
Explanation: Set up a proportion and solve.
400
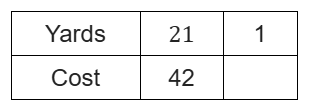
21 yards of yarn costs $42. What is the price per yard?
$2 per yard
Explanation: Use a ratio table.
500
Paul plots the following points on a graph.
(0, 0), (1, 3), (2, 7), and (3, 15)
Do his points represent a proportional relationship? Explain.
No. Although (0, 0) is a point on the graph, the points do not form a straight line. In addition, there is no constant of proportionality (k-value) that can x can be multiplied by to get y.
Example: For point (1, 3), 1 x 3 = 3. For point (2, 7), 2 x 3 is 6 not 7.
500
Write an equation for the proportional relationship shown in the table below. (Hint: Find the k-value.)

For the point (2, 3), 2 x 1.5 = 3. For the point (4, 6), 4 x 1.5 = 6). Therefore, k = 1.5.
Answer: y = 1.5x
500
Are the ratios below proportional? Explain.
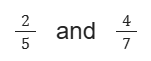
No. To get from 2 to 4, you multiply by 2. However, 5 multiplied by 2 is not 7. Also, the cross-products are not equal (14 is not equal to 20).
500
The triangles below are similar. This means that the sides have a proportional relationship. What is the value of x?
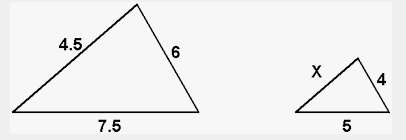
x = 3
Explanation: Since 7.5 divided by 1.5 = 5 and 6 divided by 1.5 = 4, then 4.5 divided by 1.5 = 3.
500
The scale factor for a model airplane to a real airplane is 1 in : 9ft.
What is the scale factor of the model? (Hint: How many inches are in 1 foot?)

Explanation: Set up a proportion to find out how many inches are in 9 ft. Then replace the 9 ft in the original ratio with the equivalent inches and then write the new ratio as a fraction.
500
Complete this ratio table:
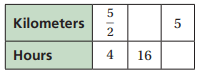
Top missing number: 10
Bottom missing number: 8
Explanation:
4 x 4 = 16, so 52 x 4 = 10
10 2 = 5, so 16 2 = 8.