Pearson
Spearman
Chi-square
Miscellaneous
100
An educational scientist wants to examine the correlation between years of education and job satisfaction. To address this question, the scientist recruits a group of participants and has each complete a self-administered survey; the first question asks how many years of education the participant has (e.g., 12 = high school diploma, 14 = associate’s degree, 16 = bachelor’s degree, 18 = master’s degree). The remaining questions consist of the Acme Job Satisfaction Index (AJSI), which produces a score between 0 and 60 (0 = very unsatisfied with job, 60 = very satisfied with job). What is the null hypothesis? Be sure to use the correct notation.
- H0: There is no correlation between years of education and job satisfaction
- H0: There is a correlation between years of education and job satisfaction
- H1: There is no correlation between years of education and job satisfaction
- H1: There is a correlation between years of education and job satisfaction
- H0: There is no correlation between years of education and job satisfaction
100
Ariel and Dusty want to determine how similar their movie preferences are. They independently rank the 13 movie categories with their favorite at the top. What is the null hypothesis?
- H0: There is a significant correlation in movie type preferences between Ariel and Dusty.
- H0: There is no significant correlation in movie type preferences between Ariel and Dusty.
- H1: There is a significant correlation in movie type preferences between Ariel and Dusty.
- H1: There is no significant correlation in movie type preferences between Ariel and Dusty.
- H0: There is no significant correlation in movie type preferences between Ariel and Dusty.
100
To determine if how data are gathered has any bearing on responses to a question involving substance abuse (“Have you ever used an illegal drug?”), you recruit willing participants and randomly assign them to one of three groups: Those in Group 1 will be asked the question via face-to-face interview, those in Group 2 will respond using a standard pencil-and-paper mail-in survey, and those in Group 3 will be directed to an online survey; no names or identifying information will be gathered from any of the participants. What is the null hypothesis?
- H0: Responses vary across media (face-to-face interview, mail-in survey, online survey) when it comes to asking about substance abuse.
- H0: Responses are the same across media (face-to-face interview, mail-in survey, online survey) when it comes to asking about substance abuse.
- H1: Responses are the same across media (face-to-face interview, mail-in survey, online survey) when it comes to asking about substance abuse.
- H1: Responses vary across media (face-to-face interview, mail-in survey, online survey) when it comes to asking about substance abuse.
- H0: Responses are the same across media (face-to-face interview, mail-in survey, online survey) when it comes to asking about substance abuse.
100
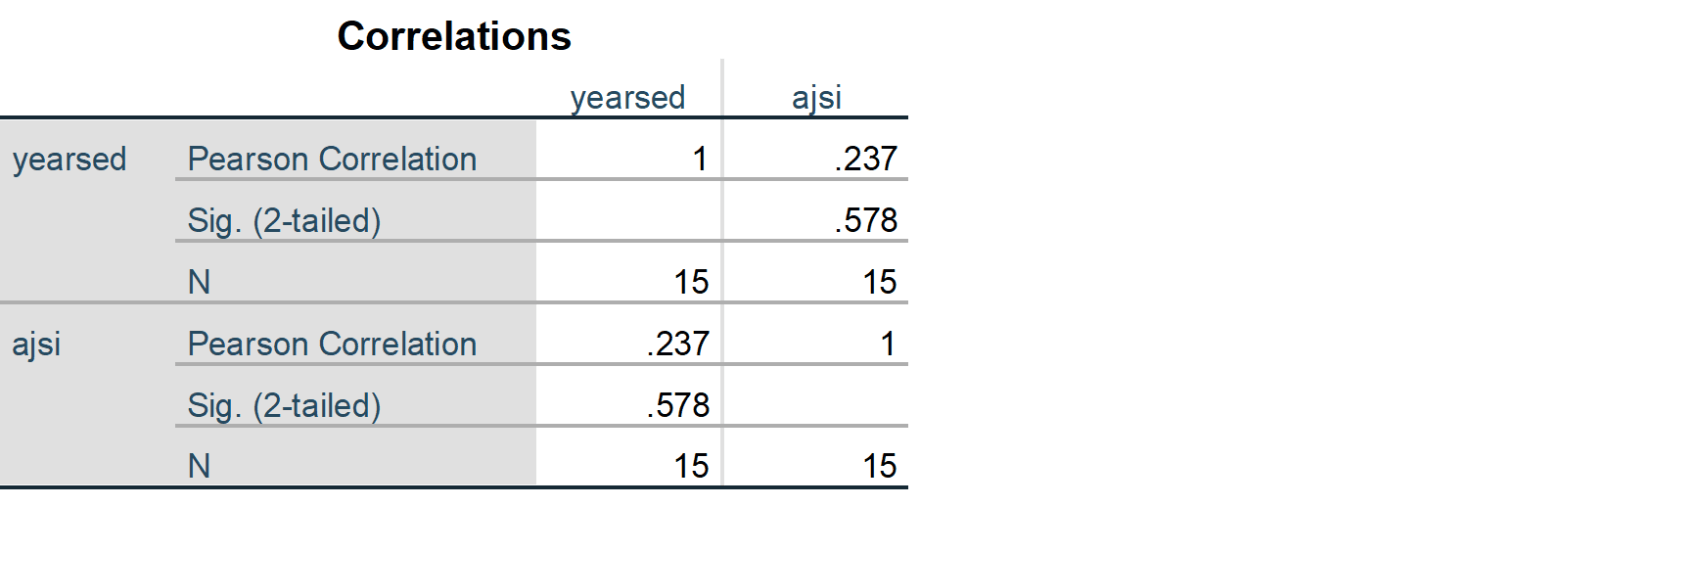 Based on the below output, answer the following questions. What is the r value? What type of correlation exists (negative or positive, strong or weak)? What is the p-value? Using a .05 α level, is this a statistically significant correlation or not?
- The r value is .237, which is a weak positive correlation. The p-value is .578, which means that this is not a statistically significant correlation.
- The r value is .578, which is a weak positive correlation. The p-value is .237, which means that this is not a statistically significant correlation.
- The r value is .237, which is a weak positive correlation. The p-value is .578, which means that this is a statistically significant correlation.
- The r value is .237, which is a strong positive correlation. The p-value is .578, which means that this is not a statistically significant correlation.
- The r value is .237, which is a weak positive correlation. The p-value is .578, which means that this is not a statistically significant correlation.
200
An educational scientist wants to examine the correlation between years of education and job satisfaction. To address this question, the scientist recruits a group of participants and has each complete a self-administered survey; the first question asks how many years of education the participant has (e.g., 12 = high school diploma, 14 = associate’s degree, 16 = bachelor’s degree, 18 = master’s degree). The remaining questions consist of the Acme Job Satisfaction Index (AJSI), which produces a score between 0 and 60 (0 = very unsatisfied with job, 60 = very satisfied with job). What is the alternate hypothesis? Be sure to use the correct notation.
- H0: There is no correlation between years of education and job satisfaction
- H0: There is a correlation between years of education and job satisfaction
- H1: There is no correlation between years of education and job satisfaction
- H1: There is a correlation between years of education and job satisfaction
- H1: There is a correlation between years of education and job satisfaction
200
Ariel and Dusty want to determine how similar their movie preferences are. They independently rank the 13 movie categories with their favorite at the top. What is the alternate hypothesis?
- H0: There is a significant correlation in movie type preferences between Ariel and Dusty.
- H0: There is a significant correlation in movie type preferences between Ariel and Dusty.
- H1: There is a significant correlation in movie type preferences between Ariel and Dusty.
- H1: There is no significant correlation in movie type preferences between Ariel and Dusty.
- H1: There is a significant correlation in movie type preferences between Ariel and Dusty.
200
To determine if how data are gathered has any bearing on responses to a question involving substance abuse (“Have you ever used an illegal drug?”), you recruit willing participants and randomly assign them to one of three groups: Those in Group 1 will be asked the question via face-to-face interview, those in Group 2 will respond using a standard pencil-and-paper mail-in survey, and those in Group 3 will be directed to an online survey; no names or identifying information will be gathered from any of the participants. What is the alternate hypothesis?
- H0: Responses vary across media (face-to-face interview, mail-in survey, online survey) when it comes to asking about substance abuse.
- H0: Responses are the same across media (face-to-face interview, mail-in survey, online survey) when it comes to asking about substance abuse.
- H1: Responses are the same across media (face-to-face interview, mail-in survey, online survey) when it comes to asking about substance abuse.
- H1: Responses vary across media (face-to-face interview, mail-in survey, online survey) when it comes to asking about substance abuse.
- H1: Responses vary across media (face-to-face interview, mail-in survey, online survey) when it comes to asking about substance abuse.
200
Explain what linearity is.
- Linearity is when all the given points fit a pattern that closely resembles a line.
- Linearity is when all the given points fit a pattern that closely resembles a curve.
- Linearity is when there are more points in the middle of the data and less at the ends.
- Linearity is when there are more points at the ends of the data and less in the middle.
- Linearity is when all the given points fit a pattern that closely resembles a line.
300

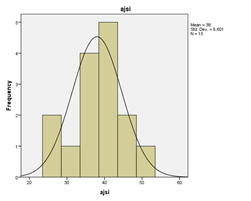 Based on the two histograms below, is the pretest criterion of normality satisfied? Explain why or why not.
- Both histograms appear to be normal so the criteria is satisfied.
- The yearsed histogram is skewed right and the ajsi histogram is normal so the the criteria is satisfied.
- The yearsed histogram is skewed left and the ajsi histogram is normal so the the criteria is satisfied.
- The yearsed histogram is skewed right and the ajsi histogram is normal so the the criteria is not satisfied.
- Both histograms appear to be normal so the criteria is satisfied.
300
Is the criterion of independence satisfied?
- Ariel and Dusty look at each other’s ratings while ranking their preferences, so this criterion is not satisfied.
- Ariel and Dusty look at each other’s ratings while ranking their preferences, so this criterion is satisfied.
- Ariel and Dusty rank their choices independently, so this criterion is satisfied.
- Ariel and Dusty rank their choices independently, so this criterion is not satisfied.
- Ariel and Dusty rank their choices independently, so this criterion is satisfied.
300
 Based on the Crosstabulation table, is the pretest criterion for each cell satisfied?
- The pretest criterion is not satisfied because every cell is 5 or larger.
- The pretest criterion is satisfied because every cell is 10 or larger.
- The pretest criterion is not satisfied because every cell is 10 or larger.
- The pretest criterion is satisfied because every cell is 5 or larger.
- The pretest criterion is satisfied because every cell is 5 or larger.
300
What is a polychotomous variable? Give an example of one and the values that it would take.
- A polychotomous variable is a categorical variable that takes on three or more values. An example of a polychotomous variable is ice cream flavor as it could take on values such as Chocolate, Vanilla, Strawberry, and many more.
- A polychotomous variable is a categorical variable that takes on three or more values. An example of a polychotomous variable is attendance where someone can either be Present or Absent from an event.
- A polychotomous variable is a categorical variable that takes on only two values. An example of a polychotomous variable is attendance where someone can either be Present or Absent from an event.
- A polychotomous variable is a categorical variable that takes on only two values. An example of a polychotomous variable is ice cream flavor as it could take on values such as Chocolate, Vanilla, Strawberry, and many more.
- A polychotomous variable is a categorical variable that takes on three or more values. An example of a polychotomous variable is ice cream flavor as it could take on values such as Chocolate, Vanilla, Strawberry, and many more.
400
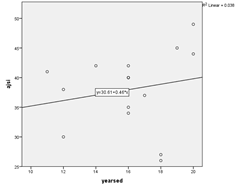
Based on the scatterplot below, are the criteria for linearity and homoscedasticity satisfied? Explain why or why not.
- The scatterplot appears to follow a linear pattern, so linearity is satisfied. The homoscedasticity criteria is satisfied because there are more points in the middle than at each end.
- The scatterplot appears to follow a curvilinear pattern, so linearity is not satisfied. The homoscedasticity criteria is satisfied because there are more points in the middle than at each end.
- The scatterplot appears to follow a linear pattern, so linearity is satisfied. The homoscedasticity criteria is not satisfied because there are more points at the ends than in the middle.
- The scatterplot appears to follow a curvilinear pattern, so linearity is not satisfied. The homoscedasticity criteria is not satisfied because there are more points at the ends than in the middle.
- The scatterplot appears to follow a linear pattern, so linearity is satisfied. The homoscedasticity criteria is satisfied because there are more points in the middle than at each end.
400
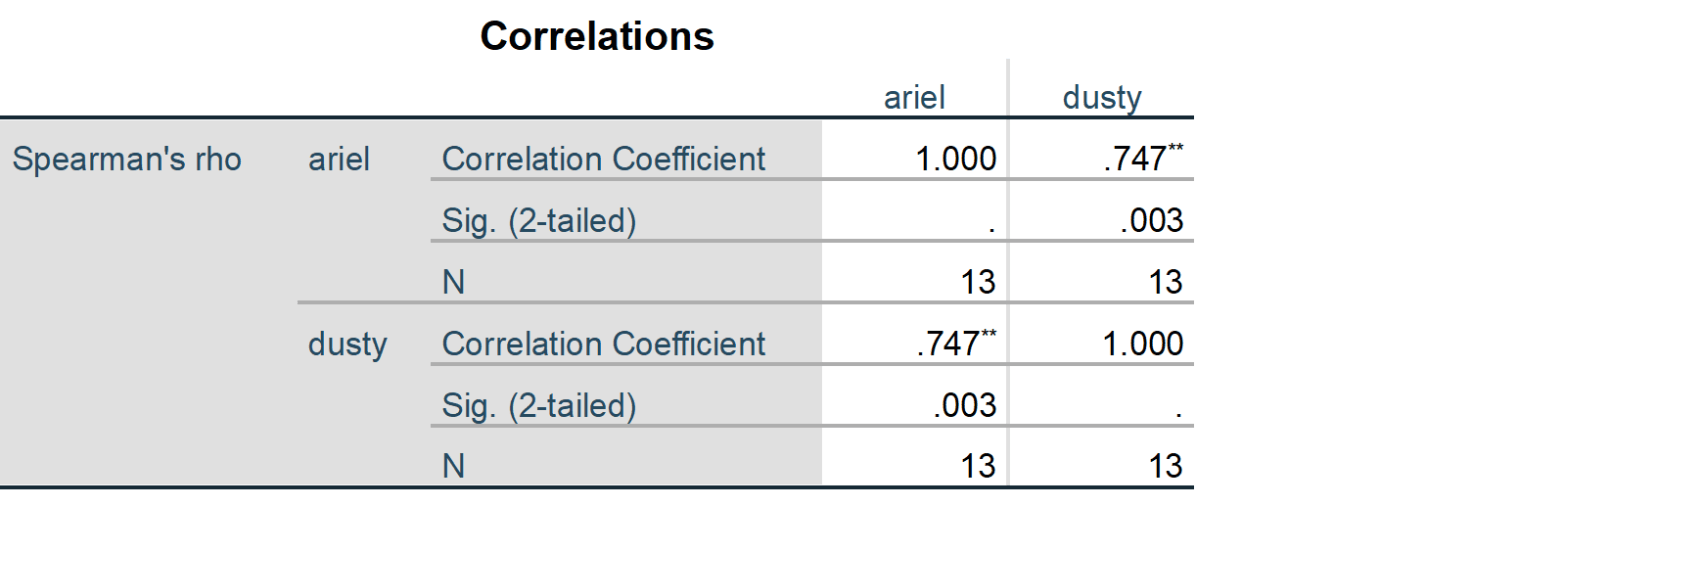 Based on the results of the Spearman correlation, comment on the overall study, including the p-value and state your decisions on rejecting or not rejecting the null hypothesis.
- The Spearman’s rho is .747. Since the p-value is .003, we do not reject H0. Therefore, there is evidence to support that there is no correlation between Ariel’s and Dusty’s preferences.
- The Spearman’s rho is .747. Since the p-value is .003, we reject H0. Therefore, there is evidence to support that there is a correlation between Ariel’s and Dusty’s preferences.
- The Spearman’s rho is .003. Since the p-value is .747, we do not reject H0. Therefore, there is evidence to support that there is no correlation between Ariel’s and Dusty’s preferences.
- The Spearman’s rho is .747. Since the p-value is .003, we reject H0. Therefore, there is evidence to support that there is no correlation between Ariel’s and Dusty’s preferences.
- The Spearman’s rho is .747. Since the p-value is .003, we reject H0. Therefore, there is evidence to support that there is a correlation between Ariel’s and Dusty’s preferences.
400
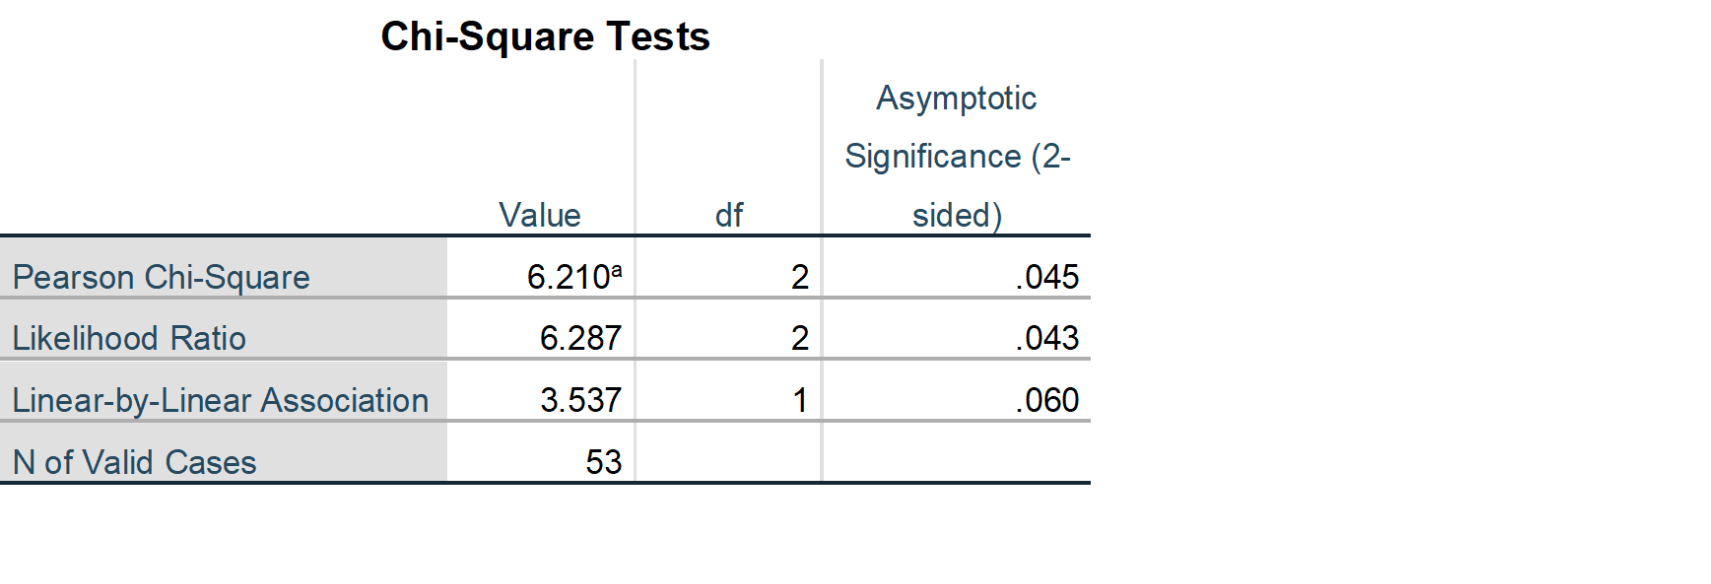 Based on the results of the chi-square test, comment on the overall study, including the p-value and state your decisions on rejecting or not rejecting the null hypothesis.
- The p-value is .045, so we do not reject H0. There is evidence to support that responses are the same across media.
- The p-value is .045, so we reject H0. There is evidence to support that responses are the same across media.
- The p-value is .045, so we do not reject H0. There is evidence to support that responses vary across media.
- The p-value is .045, so we reject H0. There is evidence to support that responses vary across media.
- The p-value is .045, so we reject H0. There is evidence to support that responses vary across media.
400
What is area sampling?
- Area sampling is a sampling technique where the sample is broken down into blocks and a select number of households are sampled from each block.
- Area sampling is a sampling technique where the sample is broken down into strata and samples are randomly taken from each strata.
- Area sampling is a sampling technique where participants need to meet specified criteria in order to be included in the sample.
- Area sampling is a sampling technique where the sample is constructed based on people near the researcher.
- Area sampling is a sampling technique where the sample is broken down into blocks and a select number of households are sampled from each block.
500
 Based on the results of the Pearson correlation, comment on the overall study, including the p-value and state your decisions on rejecting or not rejecting the null hypothesis.
- The Pearson correlation is .196. Since the p-value is .484, we do not reject H0. Therefore, there is evidence to support that there is no correlation between years of education and job satisfaction.
- The Pearson correlation is .196. Since the p-value is .484, we do not reject H0. Therefore, there is evidence to support that there is a correlation between years of education and job satisfaction.
- The Pearson correlation is .484. Since the p-value is .196, we reject H0. Therefore, there is evidence to support that there is no correlation between years of education and job satisfaction.
- The Pearson correlation is .196. Since the p-value is .484, we reject H0. Therefore, there is evidence to support that there is a correlation between years of education and job satisfaction.
- The Pearson correlation is .196. Since the p-value is .484, we do not reject H0. Therefore, there is evidence to support that there is no correlation between years of education and job satisfaction.
500
- Joshua and Jermaine are asked to rank the following artists in order from most favorite to least favorite: Miley Cyrus, Luke Bryan, and Kendrick Lamar.
- Jermaine’s rankings Joshua’s rankings
- Luke Bryan Kendrick Lamar
- Miley Cyrus Miley Cyrus
- Kendrick Lamar Luke Bryan
- What is the Spearman’s rho for this ranking?
- 0
- 1
- -1
- .67
-1
500
 Based on the graphic below, which type of media was more likely to have respondents answer that that they had used an illegal drug?
- People were more likely to say that they had used an illegal drug in mail-in surveys and face-to-face interviews than online surveys.
- People were more likely to say that they had used an illegal drug in mail-in surveys and online surveys than face-to-face interviews.
- People were more likely to say that they had used an illegal drug in online surveys and face-to-face interviews than mail-in surveys.
- People were more likely to say that they had used an illegal drug in mail-in surveys than online surveys and face-to-face interviews.
- People were more likely to say that they had used an illegal drug in mail-in surveys and online surveys than face-to-face interviews.
500
Which of the following studies would be best analyzed by a logistic regression?
- Independent: Number of hours spent studying, Dependent: grade on exam 3
- Independent: number of people in the neighborhood at the time of the burglary, Dependent: if a burglary occurs or not
- Independent: Number of hours spent studying and grade on exam 2, Dependent: grade on exam 3
- Independent: daily jail population, Dependent: number of violent jail incidents
- Independent: number of people in the neighborhood at the time of the burglary, Dependent: if a burglary occurs or not