Histograms + Box and Whisker Plots
Describing Data
Linear Inequalities
Scatterplots and Correlation
Parallel and Perpendicular
100
A group of 30 basketball players each attempted 25 free throws. The number of successful attempts is shown in the histogram below.

How many basketball players made between 0 to 10 free throws?
15
100
Determine whether the represented data is symmetric, right skewed, or left skewed.

symmetrical
100
Write down the inequality which describes the region shown
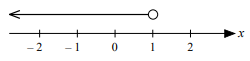
x<1
100
What are the three types of correlation that could be seen in a linear scatterplot?
positive, negative, no correlation
100
Parallel lines have _________ slope.
the same
200
Scot was interested in buying a car and one of the considerations he had was the cost of car repairs for the vehicle in which he was interested. The cost of car repairs for a vehicle is shown in the box-and-whiskers graph below.

About what percent of the repairs of this vehicle cost more than $300?
50%
200
Determine whether the represented data is symmetric, right skewed, or left skewed.

right skewed
200
Write down the inequality which describes the region shown
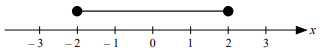
-2<=x<=2
200
If a scatterplot has a correlation coefficient of -0.92, it can be said that the graph has what kind of correlation?
strong negative correlation
200
Is the following graph showing parallel or perpendicular lines?
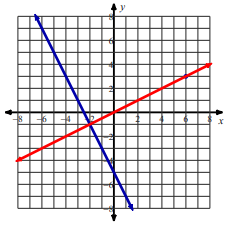
perpendicular
300
The graph shows times for runners in the 50-yard dash.

How many runners ran the distance in less than 7.0 seconds?
11 runners
300
This chart shows how students arrive at Oak Street School.

How many students at Oak Street School ride the bus?
20
300
Sara earns $9 per hour babysitting. She must earn a minimum of $81 next month to attend a concert. If h represents the number of hours Sara babysits, write an inequality to describe the situation.
9h>=81
300
The scatterplot below shows the ages of some children and the distance each child lives from school.
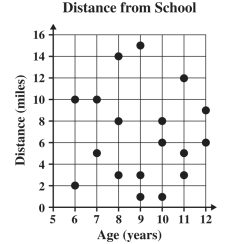
Describe the relationship between age and distance from school.
There is no correlation/no relationship.
300
Perpendicular lines have __________ __________ slope.
opposite reciprocal
400
Last month members of a Fostoria youth group spent time doing community service. The graph shows the numbers of students who contributed certain hours of service.

How many members spent 10 or more hours in community service last month?
12
400
Jenna listed the heights, in inches, of 17 of her classmates, as shown below.
50, 52, 55, 56, 57, 58, 59, 59, 60, 61, 62, 62, 63, 63, 63, 65, 68
What is the median of the data?
60
400
Ms. Salgado needs to have her car repaired but does not want to spend more than $375 for the repairs. The mechanic says that the part needed for the repair will cost $100 and the labor will cost an additional $40 per hour. Write the inequality that represents this situation.
100+40x<=375
400
The scatterplot below shows the time cheese has been aging and the amount of lactic acid present in the cheese.
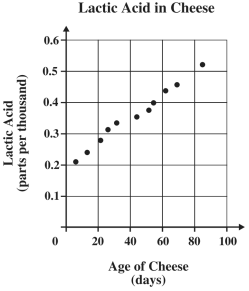
Describe the relationship between the age of cheese and lactic acid present.
Strong positive correlation, as age of cheese increases the amount of lactic acid increases.
400
Create an equation of a line in slope-intercept form that is parallel to the given line:
y=3x+9
y=3x+b
500
The box and whisker graph shown below represents the results of a survey of the estimated gas mileage of 100 car models.

Which statistics--mean, median, mode, range--can be determined from this graph?
range and median
500
A local car dealership has 100 vehicles on its lot. The chart below shows the numbers of cars, vans, and trucks, both new and used.

Based on the chart, what percent of the 100 vehicles are either new cars or new trucks?
13%
500
The cost of renting a boat is $20 plus $2.50 per hour, where x is the number of hours of boat rental. Millie wants to spend less than $50 on the boat rental. Write the inequality that represents the situation.
20+2.50x<50
500
The scatterplot below shows the costs of phone calls of different lengths.
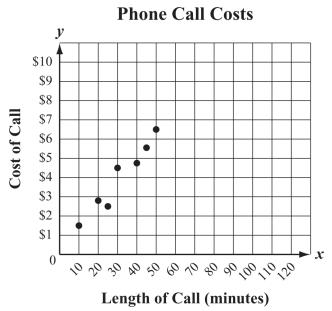
Based on the line of best fit for the scatterplot, what is closest to the length of a call that costs $10?
80 minutes
500
Create an equation of a line in slope-intercept form that is perpendicular to the given line:
y=1/2x-7
y=-2x+b