Vocabulary
Organizing data
Sampling
Measures of the Center
Measures of the Spread
100
If I am curious about the average weight of the fish in a lake by my house. I go fishing and weigh the thirty fish I catch. The average weight of the fish that I catch is called a ________________.
statistic
100
When creating a frequency distribution, the class intervals should be ___________.
equal in size
100
The goal of sampling is to get a ___________ sample.
random
100
What does this symbol represent in statistics?
mu
the mean of the population
100
The ____________________ measures how far each data value deviates from the mean.
standard deviation
200
If I am curious about the average weight of the fish in a lake by my house. I go fishing and weigh the thirty fish I catch. The weights of the fisht hat I catch is called ________________.
Data
200
The largest data value minus the smallest data value is called the __________.
range
200
If I break the population into 40 subgroups and choose all the members of the 9th subgroup this is ____________ sampling.
cluster
200
Which measure of central tendency is the least affected by outliers?
Mode
200
If more spread out the data the _____________ the standard deviation.
larger
300
Categorize this data as nominal, ordinal, interval or ratio - my income this year.
ratio
300
The 3rd quartile is the same as the ________.
75th percentile
300
If I put the members of the population in order and choose every 4th piece of data, it is called __________________ sampling.
systematic
300
What is the mean of this frequency distribution?
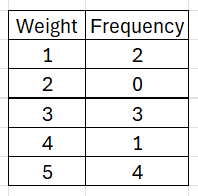
3.5
300
The symbol for the population standard deviation is _______.
sigma,
sigma
400
If I find a piece of data where 30% of the data is less than or equal to this value I have found the _______.
30th percentile
400
The IQR is calculated by taking _________________, and measures the ________of the middle 50% of the data
Q3 - Q1 , spread
400
An additional variable that can cloud a study is called a _______________ variable.
lurking
400
The mean of a sample is called _____
x bar
400
The z-score is the way to measure the number of ______________________ a data value is from the mean.
standard deviations
500
Use this data to find the relative frequency of the fish weighing 10-14 lbs
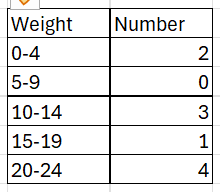
3/10
500
The number of standard deviation the value is away from the mean is called the _____________.
z-score
500
If I take a sample of 20 students and have them use Khan academy to prepare for a test and another group of 20 students and have them go to STEM lab to prepare, using Khan academy and going the STEM labs are called __________________.
Treatments
500
If I am interested in which measure of central tendency best describes the tests scores of the class in terms of how the average student did, which of the three measures of central tendency would be best to use?
Median
500
If the mean score of a test is 75 and the standard deviation is 2, what is the z-score of a grade of 71?
z = -2