Find the Mean, Median and Mode:
12, 12, 14, 13, 12, 15, 16, 15, 11, 10, 12, 13
Mean: 12.9
Median: 12.5
Mode: 12
What is the five number summary?
Minimum
Q1
Median
Q3
Maximum
What is the difference between a histogram and a bar graph.
Histograms look at intervals were bar graphs look at different categories.
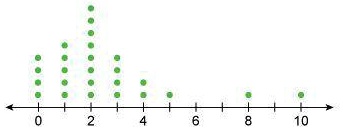
Is this Line Plot Skewed Left or Right?
RIGHT!
What does TAILS stand for?
T- Title
A- Axes
I- Interval
L- Labels
S- Scale
What is the most appropriate measure of center for the following data and why:
43, 45, 47, 41, 41, 43, 18, 40, 39, 46, 41, 42
Median because there is an outlier.
What percent of the data falls within each quartile?
What percent of the data falls within the IQR?
25% of the data falls in each quartile
50% of the data falls in the IQR
Which interval had the highest number of students?

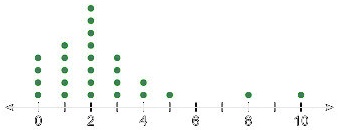
Is this line plot skewed left or skewed right?
LEFT!!
What is 12% of 75?
9
What is the most appropriate measure of center for this data set?
4, 6, 7, 2, 3, 5, 3, 2, 1, 6, 7, 8, 6, 5, 5, 3
Mean because there are no outliers and the data is all relatively close together.
What can you conclude from a whisker that is much longer than another whisker?
The longer the whisker, the more spread out the data in that quartile is, the shorter the whisker, the more clustered the data in that quartile is
What percent of vice presidents were younger than 60 years old?
75%
Write three sentences to describe this data
Answers will vary. Miss McGill will check
If there is an outlier in the data, what measure of center do we use?
MEDIAN!!!
John recorded the distance he drove each week. If he wanted his average distance driven to be 50 miles, how much would he have to drive on the 7th day.
44, 41, 39, 37, 51, 32, 60
He would need to drive 46 miles.
True or False: You could calculate the mean from just an image of a box plot.
False because a box plot DOES NOT give us individual data.
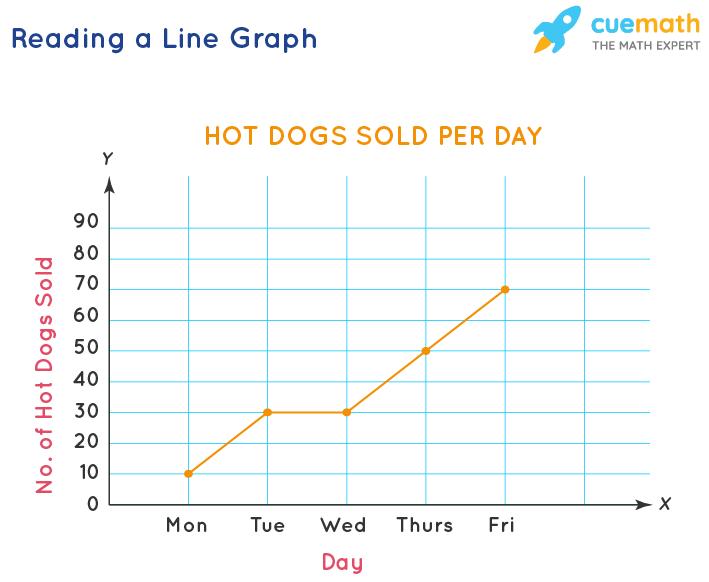
Predict how many hot dogs would be sold on Saturday.
Around 90 hotdogs
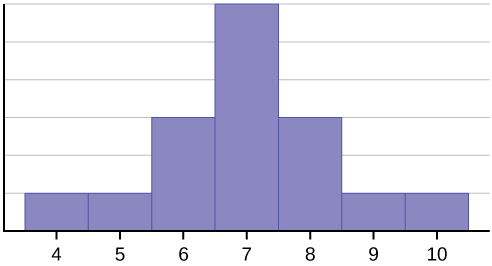
What would be the most appropriate measure of center and variation for this bar graph?
Mean and Range because it is symmetric.
Which measure of center is most affected by an outlier?
The mean is the most affected by an outlier because an outlier will either pull the mean way up (if the outlier is much larger than most of the data) or it will pull the mean way down (if the outlier is much smaller than most of the data)
If Lisa wanted to end the term with an overall average of 90. What would she need to score on her 5th test, if her current scores are as follows:
88, 86, 92, 83
She would need to score a 101%
Construct a box plot for the following data:
10, 12, 13, 12, 14, 13, 12, 11, 12, 16, 15, 15
What percent of the data falls above 12?
Miss McGill will come around and check these.
75% of the data falls above 12
Please give an overview of what each data displays shows us:
Histogram-
Bar graph-
Line Plots-
Box Plots-
Line Graph-
Answers will vary. Miss McGill will check answers.
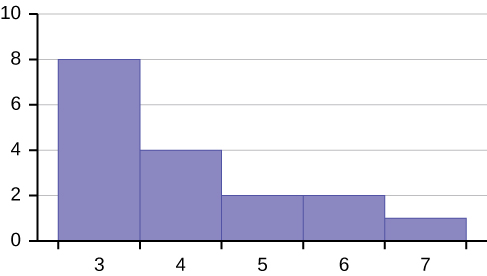
What is the most appropriate measure of center and variation for this bar graph?
Median and IQR because it is skewed right.
What year did Miss McGill graduate from the DSMS?
2011 :)