Percentile and Z-scores
Graphical Displays
Linear Transformations
Collecting Data
Hodge Podge
100
1, 2, 3, 4, 5, 6, 7, 8, 9, 10. What percentile is the 8?
8/10 = 80th percentile
100
What must every graph have when you draw it?
Title, Axis, increments, labels and scale
100
The mean is 20 and standard deviation is 2. What are the new mean and standard deviation if I multiply by 2?
Mean: 40
SD: 4
100
Amanda took a random sample of 50 HS seniors and found that they sleep an average of 5 hours a night. Is 5 a statistic or parameter?
Statistic
100
If a distribution has a mean that is higher than the median, what shape does it have?
Skewed Right
200
Find the standardized score if a student scored a 52 on a test that had a mean of 60 and a standard deviation of 6
z = (52-60)/6 = -1.33
200
What is the median? (There are 29 values)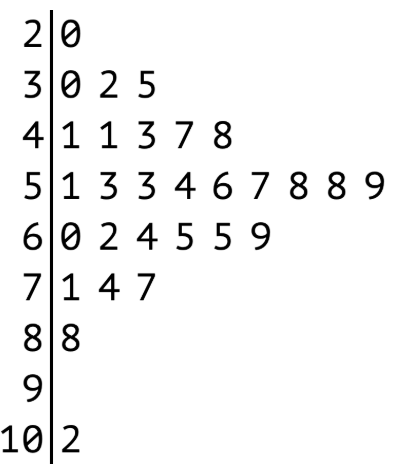
57
200
Find the mean is 10 and the Standard deviation is 3. Find the new mean and standard deviation is I subtract 3 from every number.
Mean: 7
SD: 3
200
You are collecting data on salaries in MCPS. What kind of variable is salary?
Continuous quantitative
200
Min = 6 Q1 = 10 Med = 16 Q3 = 20 and Max = 30
This is the 5 number summary for a chemistry quiz out of 30 points. Interpret the IQR.
The middle 50% of chemistry quizzes fell between 10 and 20 points.
300
Explain what is means if a child is in the 60th percentile for height for 8 year olds
The child is taller than 60% of the other 8 year old children.
300
What is the relationship between the mean and the median in this graph?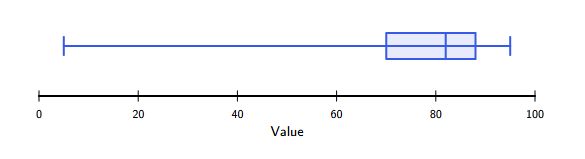
mean is less than the median
300
The data set has a median of 12 and IQR of 5. What are the new median and IQR if we divide by 2 and add 3
Median: 9
IQR: 5/2
300
What is the term when you collect data from an entire population?
Census
300
What is the name of the shape of a distribution when all the bars are the same height?
Uniform
400
Find the standard deviation if there is a standardized score (z-score) of 1.27, a mean of 25 and an observed value of 31
4.72
(31-25)/1.27
400
Describe the shapes of the distribtuions
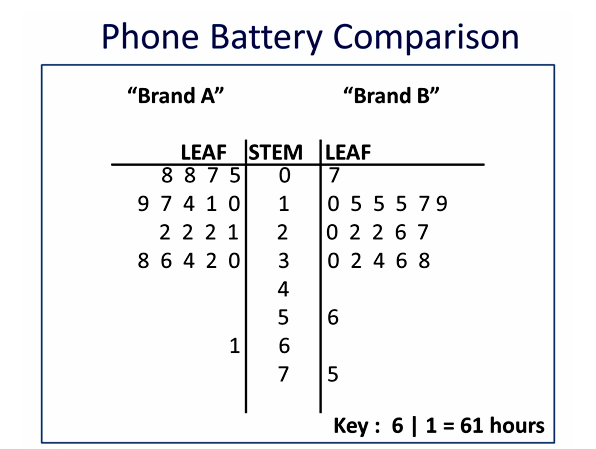
Brand A and Brand B are both skewed Right.
400
The original mean was 15 and original standard deviation was 5. The new mean is 47 and the new standard deviation 15. What were the transformations?
Multiply by 3 and add 2
400
A department store mails customers a satisfaction survey to people who make credit card purchases at the store. This month 45000 people made a credit card purchase. Surveys are mailed to 1000 of these people, chosen at random and 117 respond. What is the sample?
The 117 credit card customers who responded.
400
The average temperature in Alaska in the summer 65 degrees with a standard deviation of 8. The average temperature in summer is 86 degrees with a standard deviation of 4 degrees. Which is relatively warmer for the climate, Alaska being 80 or Brazil being 92?
Alaska since it's z-score is 1.875 which is higher than Brazil's z-score of 1.5.
500
A student earned an 87 on a test with a standard deviation of 5. Their Z-score was .96. What was the average on the test
87 - .96 (5) = 82.2
500
What are the 2 sets of formulas to find outliers? You need both sets correct for the points
Q1 - 1.5 (Q3-Q1) Q3 + 1.5 (Q3-Q1)
Mean -2 SD Mean +2SD
500
A graph of a distribution was skewed right. 30 was added to every data value and a new graph was created. What is the shape of the new distribution?
Still skewed right
500
Give an example of a number that is not a quantitative variable.
Womens clothing size, time of day, shoe size, zip code etc
500
The standard deviation of hours of sleep infants get each night is 3.1 hours. Interpret the standard in context.
The number of hours an infant sleeps typically varies from the mean hours of sleep by about 3.1 hours.