Reading Line Plots
Comparing
Whole Number Line Plots
Fraction Line Plots
Surprise!
100
Use the following line plot to answer the question:
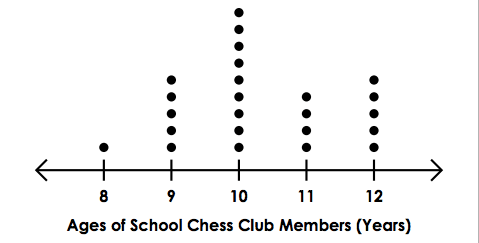
What is the most common age?
10 years old
100
4/5 ___ 6/8
4/5 is greater than 6/8
100
Use the following line plot to answer the question:
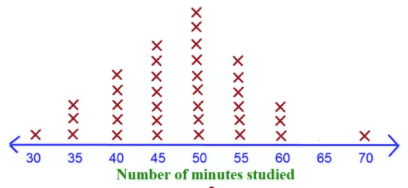
What was the LEAST common number of minutes studied?
30 and 70 minutes.
100
Use the following line plot to answer the question:
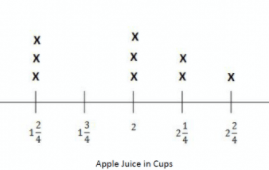
What is the total amount of juice in cups that is GREATER than 2?
7 cups
100
Look at the following data set:
8, 6, 5, 5, 3, 4, 3, 6, 7, 5, 6, 7, 8
Which number is the LEAST common?
4
200
Use the following line plot to answer the question:

What is the age of the youngest Chess Club Member?
8 years old
200
0.25 ___ 1/4
Equal to
200
Use the following line plot to answer the question:
What is the most common age?
10
200
Use the following line plot to answer the question:
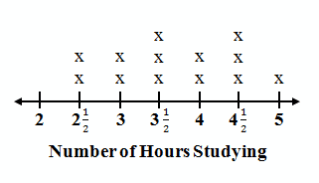
John tracked the number of hours he studied for each of his study sessions leading up to his final. How many times did he have a study session?
13 study sessions
200
230 x 4
920
300
Use the following line plot to answer the question:
What is the age of the oldest Chess Club Member?
12 years old
300
Draw 3/8.
Picture
300
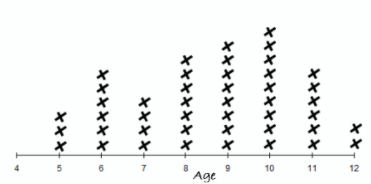
Use the following line plot to answer the question:
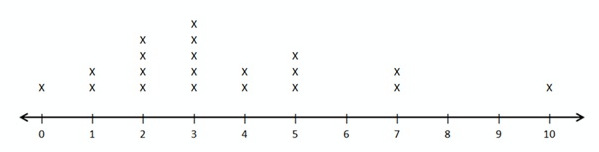 What is the most common number?
3
300
Use the following line plot to answer the question:
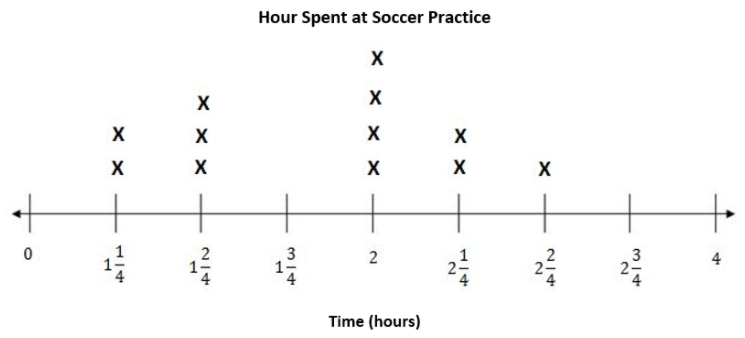
What was the most common time spent at soccer practice?
2 hours
300
327 divided by 3
109
400
Use the following line plot to answer the question:
How many Chess Club Members are younger than 11 years old?
15 Chess Club Members
400
Simplify the fraction: 6/9
2/3
400
Use the following line plot to answer the question:
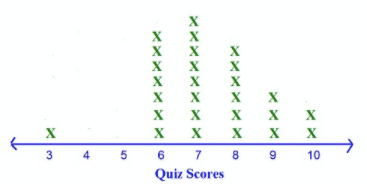
How many people scored higher than 7 on the quiz?
11
400
Use the following line plot to answer the question:
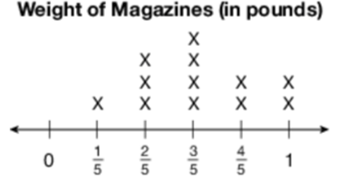
What is the difference between the heaviest and the lightest magazines?
4/5 pounds
400
Carly had $54.89. She bought a strawberry purse for $39.94. How much did she have left for lunch?
$14.95
500
Use the following line plot to answer the question:
How many total members are in the Chess Club?
24 Members
500
2/4 ___ 9/10
9/10 is greater
500
Use the following line plot to answer the question:
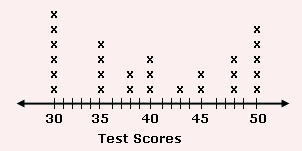
What is the difference between the highest and the lowest test scores?
50 - 30 = 20
500
What do the x's represent on a line plot?
The data
500
Perry had $27.58 in savings. He put $51.24 more in. How much does he have now?
$78.82