Tally Charts
Add and subtract
Data
Pictograms
100
How many tally marks are in the Red category?

18
100
45 + 45
90
100

What is the title of the bar graph?
Favorite Video Game Systems
100
How many cheeseburgers did Michael and John eat altogether?

Michael ate 5. John ate 4.
5 + 4 = 9 cheeseburgers
200
How many tally marks do green and yellow have in all?
18
200
32 + 46
78
200
How many students voted altogether?
22 students
200
How many children voted for football and tennis?

Football has 20 votes. Tennis has 5 votes.
20 + 5 = 25 votes altogether
300
Which colour has the least amount of tally marks?
Green
300
92 - 84 =
8
300
List players in order from from MOST to LEAST goals made. 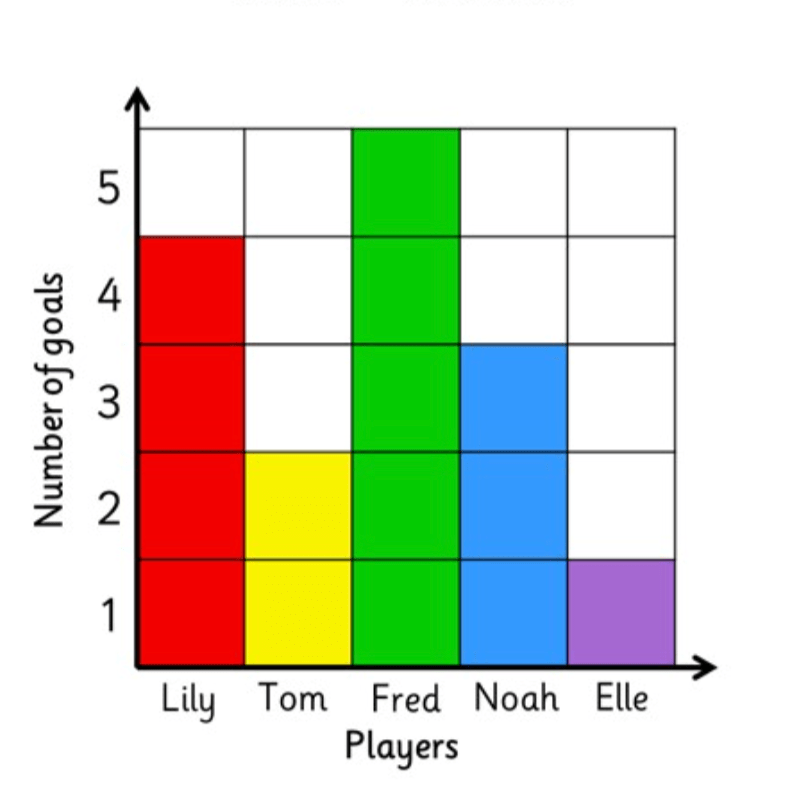
Most Least
Fred, Lily, Noah, Tom, Elle
300
How many fewer children voted for lemon than strawberry? 
Strawberry had 14 votes. Lemon has 3 votes.
14 - 3 = 11 votes
(When we compare, SUBTRACT!)
400
How many students voted for Red and Blue as their favorite color?
A. 2 students B. 16 students
C. 24 students D. 34 students
D. 34 students
400
3 + 9 + 16 + 4
3+9= 12 16+4=20
12+20= 32
400
Which animal is shown the most? 
6 sheep
400
How many more wins does Derek have than Anna?
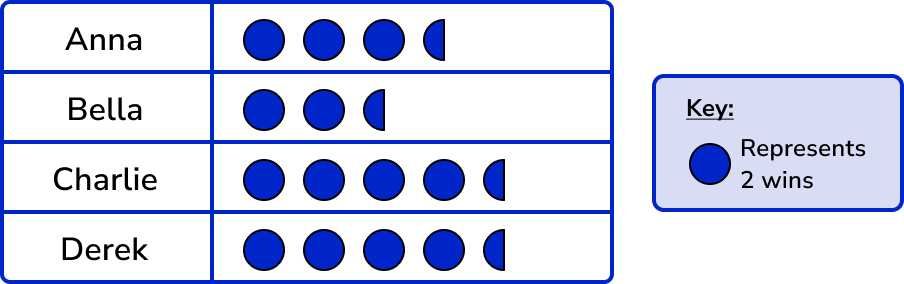
Derek has 9 wins. Anna has 7 wins
9 - 7 = 2
(When we compare, SUBTRACT!)
500
How many tally marks are there in all?
52
500
7 + 5 + 9 + 9
7+5= 12 9+9=18
12 + 18 = 30
500
Count each animal.
How many ducks, sheep, and cows are there in all?
Ducks: 3
Sheep: 6
Cows: 3
3 + 6 + 3 = 12
500
On Thursday, the hens lay 3 eggs. On Friday, the hens lay 8 eggs.
DRAW the pictogram for Thursday and Friday.

Thursday: 1 1/2 eggs drawn
Friday: 4 eggs drawn