Graphing
Substitution
Elimination
Vocabulary
100
y = 2x + 2
y = x − 1
(-3, -4)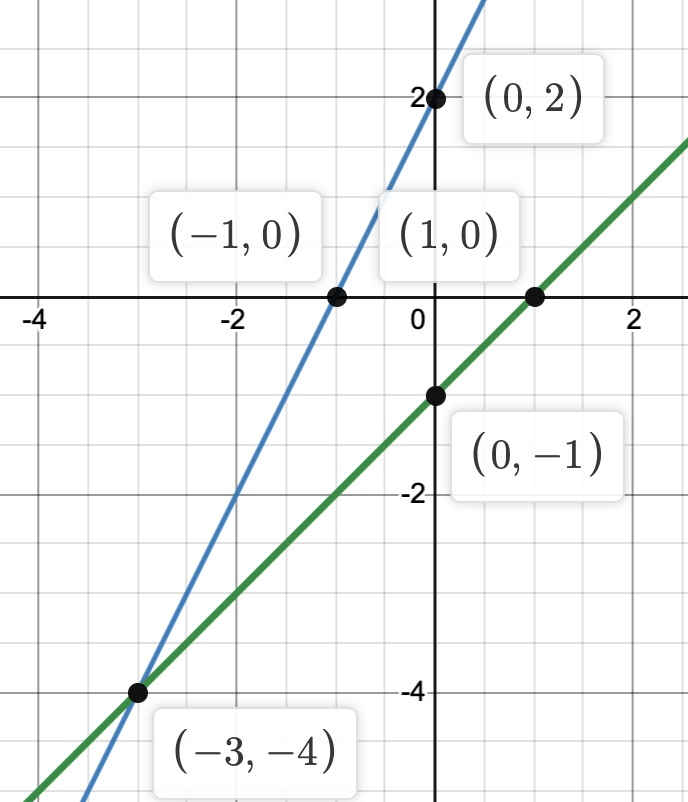
100
y = 2
3x + 2y = 10
(2, 2)
100
x + 3y = 5
2x − 3y = −8
(−1, 2)
100
Consists of two or more linear equations in the same variables.
System of linear equations (linear system)
200
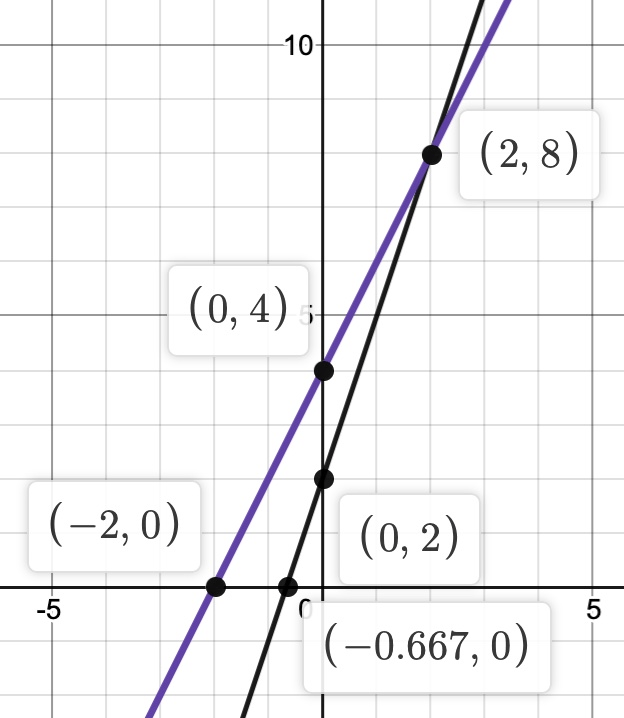
y = 2x + 4
y = 3x + 2
(2, 8)
200
x = −3y + 2
−x + 2y = 3
(−1, 1)
200
−5y + 8x = −18
5y + 2x = 58
(4, 10)
200
The method of solving equations where you add or subtract equations to end up with one variable.
Elimination or Addition Method
300
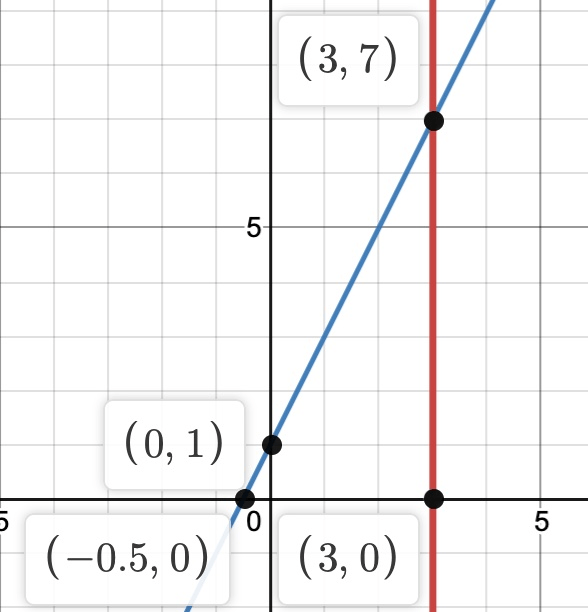
x = 3
y = 2x + 1
(3, 7)
300
x − 2y = −10
3x = y
(2, 6)
300
3y − 5x = −26
−2y − 5x = −16
(4, −2)
300
How can you tell if a linear system has infinitely many solutions?
The equations are the same, the graphed lines lie on top of one another, or solving the system provides a true statement with no variables.
400
4x + 2y = 8
2x + y = 4
Every point on 2x+y=4 is a solution.
400
2x – 3y = –2
y = −4x + 24
(5, 4)
400
3x − 4y = 8
18x − 5y = 10
(0, -2)
400
When will a system of linear equations have no solution?
The lines are parallel or they have the same slope and different y-intercepts or when you solve the equations and get a false statement with no variables remaining.
500
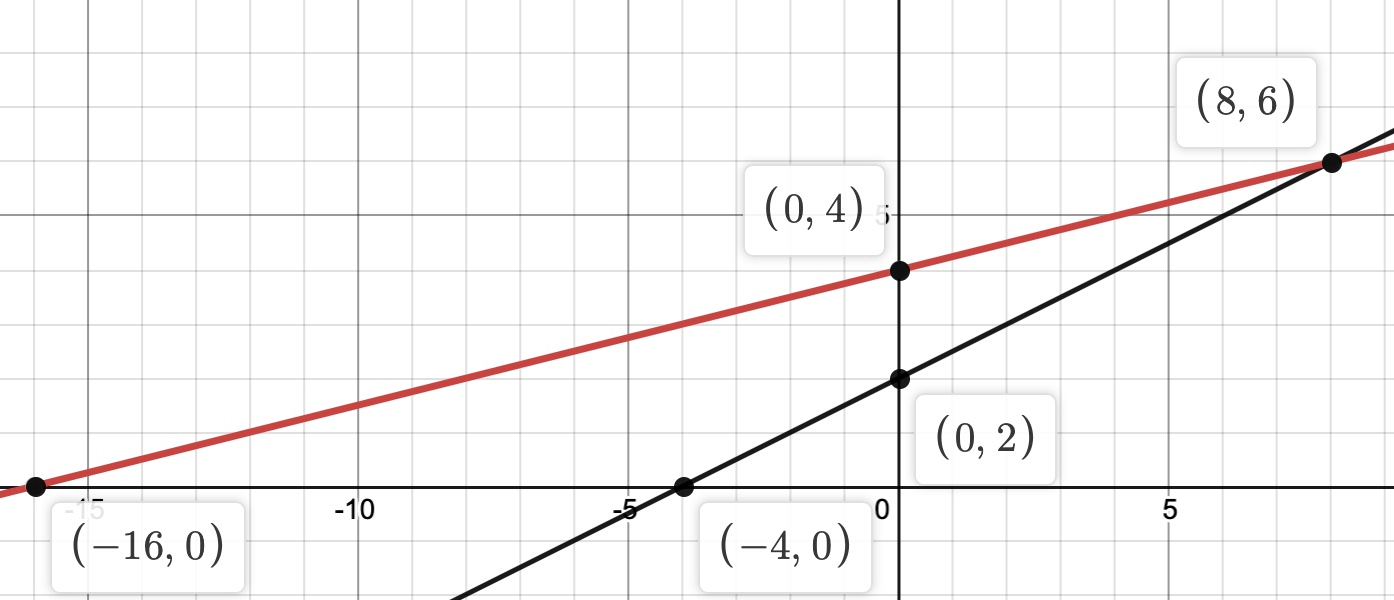
y = 1/2 x + 2
y = 1/4 x + 4
(8, 6)
500
5x − 13 = y
−5x + y = 24
no solution
500
4x−9y = 2
12x−5y = −38
(-4, -2)
500
How does the graphing method for solving a system of linear equations work?
Graph the two lines. The solution is the point(s) of intersection.